Prediction of Earnings
In Trading and everything in life, we are our worst enemy. As humans, we have a tendency to complicate things especially as we grow older. As we get older, we "over think" everything around us. For example, I am learning how to play golf. Believe it or not, Golf is very similar to trading. In Golf, you learn the mechanics of a swing. You use your body to assist the club in going through a natural movements of the swing. However, our brain interferes and don't allow the process. If you hit a ball wrong, then a golfer starts to analyze every aspect of their swing and complicates the process. They over think. The key is to develop your core in your body and have your body naturally allow the swing to happen. This has to be a habit.
Trading is very similar to Golf. It is a game against yourself too. You have to develop mechanics and then allow them to work. Allow the probabilities to execute. Instead, we get caught up in technical indicators, our opinions on a company, the EPS, etc. There are million different ways we can complicate trading. It DOES not have to be this way at all.
I am writing this article to help traders understand that they have to allow statistics to determine their trading decisions. Remember, the markets can NOT be controlled.. All you can do is find high probability situations and then trade them assuming that they will occur again. If they don't, you will exit with a small loss.
The key is how to find these high probability events. The best way is to analyze what an instrument has done in the past. If you can find a pattern on what the instrument has done in the past then you can trade it today in hopes the pattern will repeat. If it doesn't, it is not a problem. You will have a stop to get you out of the trade for a small loss.
We are going to illustrate this step by step for Earnings. Earnings is suppose to be hard to predict. Let's take something hard and complicated and simplify the process.
For this article, we will use the stocks that i posted on social media this week for earnings announcement. We will also use Alert Trades Website for seasonality (www.alerttrades.com) . It is our own website and the information that we will use is free once you register. Seasonality will be used to see what the instrument has done in the past. We will look for patterns in the past. If we don't see them, we will not trade it. If we do see a pattern in the past, we will confirm it with simple technical analysis that it can POSSIBLE occur again.
US Stock: SPTN
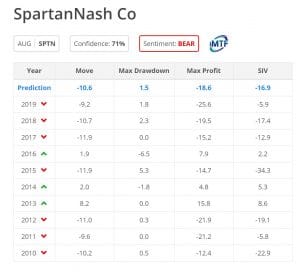
Statistics show that it has 71% of being bearish for Month of August. This is good but I look only at 80% or higher for statistics to believe them. Therefore, I am going to look for a pattern in all the years provided. There is no clear pattern. However, I notice that it has NEVER been bearish more than 3 years in a row.
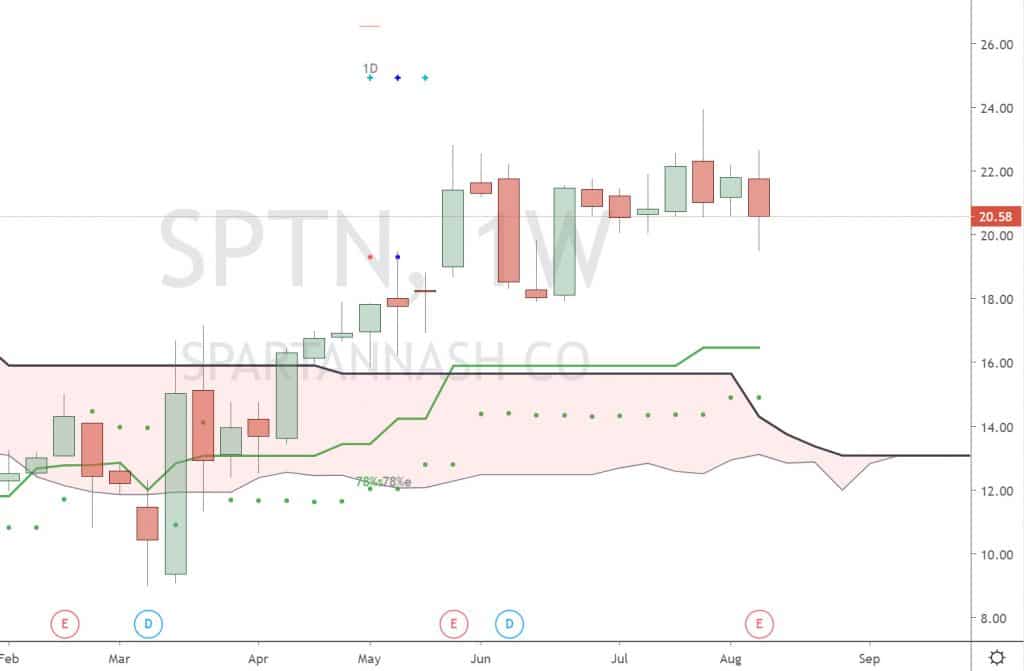
Below is the technical chart for SPTN. Notice, we are showing the Weekly time frame. Since we are dealing with quarterly charts, the time frame to use is Weekly. The goal is to enter 2-3 weeks before earnings too. This is because volatility starts to go up 2 weeks before earnings all the way to earnings. The volatility can cause a lot of "fake" price action.
For technical analysis, we will use a standard indicator called Ichimoku. It is simple and NOT a delayed indicator. How it works is simple. If price is above the cloud, the sentiment is bullish. If price is below the cloud, the sentiment is bearish. In the chart below, price is above the cloud so the sentiment is bullish. NOTE: Last bar on the chart is this week. You can see the results of earnings.
In summary, here is the trading plan. If seasonality and Ichimoku (weekly), tell us the same sentiment, we will enter 3 weeks before earnings.
Seasonality and technical told us bullish, so we entered at 20.73 which was beginning price 3 weeks before earnings.
Summary: The stock went down on earnings. It close the week at 20.58. We had entered at 20.73 so this is a small loss.
US Stock: BIDU
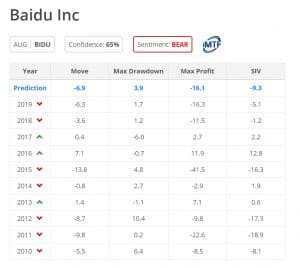
Bidu has a 65% probability of being bearish for month of August. Since it is below 80%, we will be looking at the pattern. The pattern shows, alternating two patttern. Two down years, then two up years, and now two up years. Therefore, if the pattern continues, 2020 and 2021 will be up years for month of August.
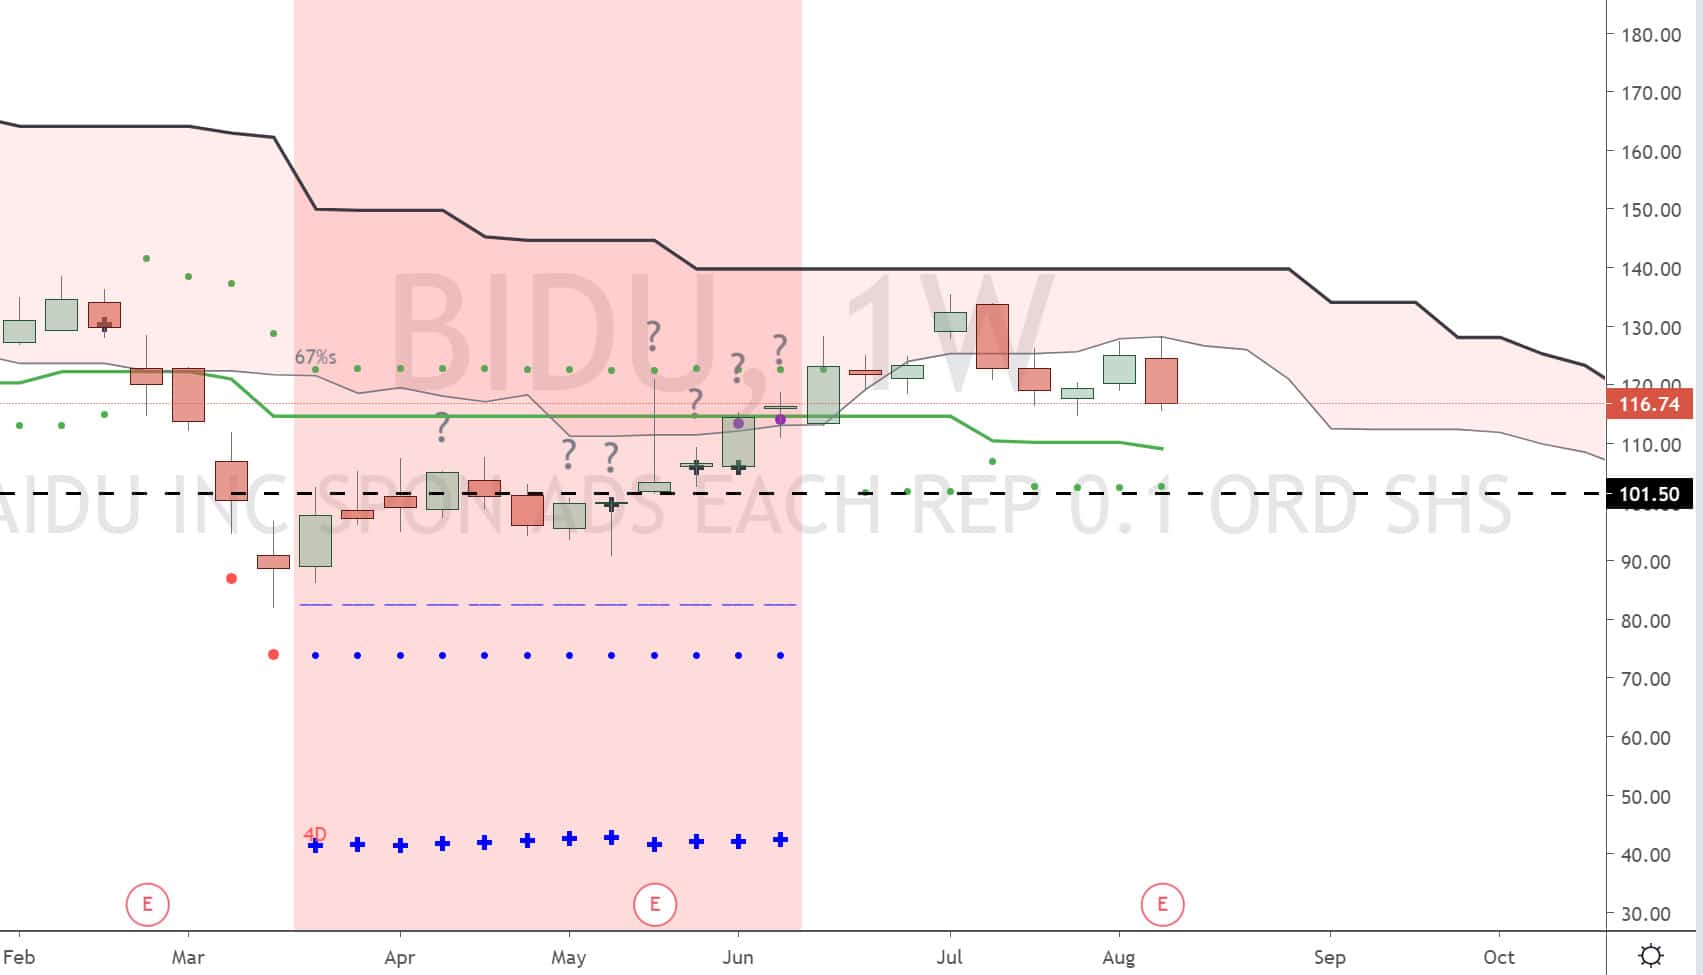
Below is the weekly chart for BIDU. Price 3 weeks ago, was below the cloud so the sentiment is bearish.
Summary: Seasonality was bullish and technical was bearish so no trade was taken. On earnings, BIDU went down so we avoided a loss with technical analysis.
US Stock: CISCO
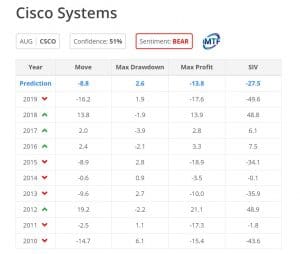
Cisco seasonality 51% bearish for month of August. This value is not good so we looked or patterns. There was a pattern of alternating 3. 2019 was bearish so there was a high probability that 2020 and 2021 will be bearish for month of august.
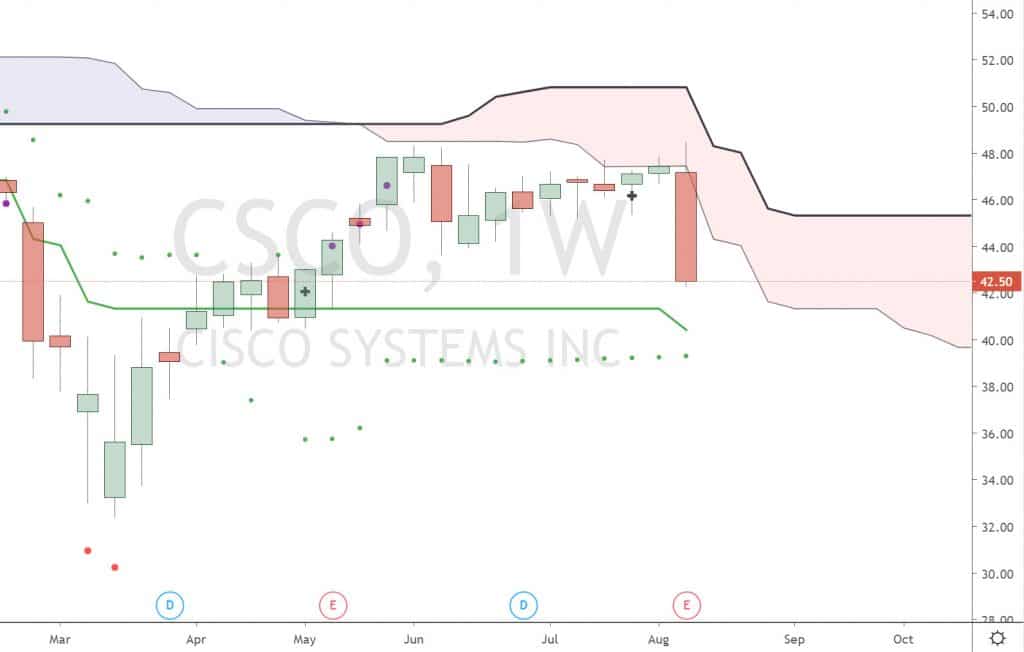
Below is the technical chart of cisco. 3 weeks ago is was below the cloud so the sentiment was bearish.
Summary: Seasonality and technical shows bearish. Therefore, the trade was entered 3 weeks ago at the price of 46.67. Today, the price is 42.50 so price did go down on earnings and this is a winning trade.
US Stock: AMAT
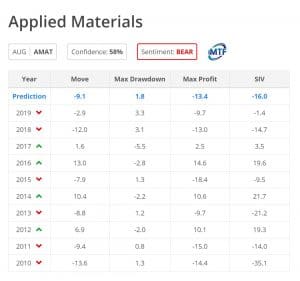
Seasonality showed 58% bearish for month of August. The number was low so we looked for a pattern. The pattern showed alternating 2. Therefore, 2020 and 2021 could be bullish for month of august.
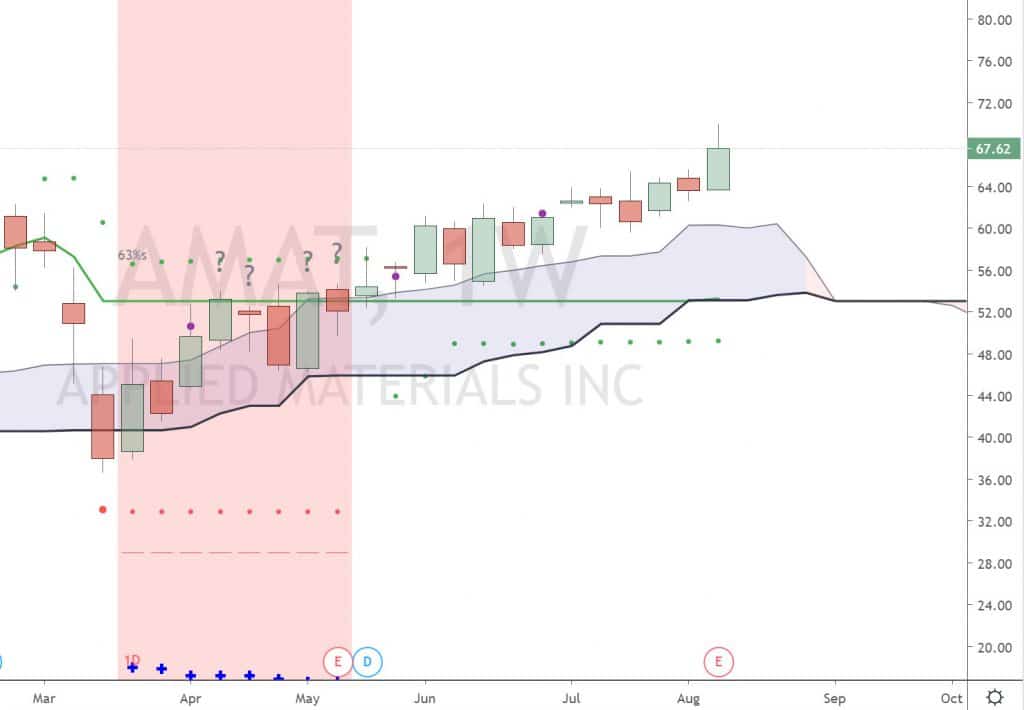
Below is the weekly chart. It showed price was above the cloud 3 weeks ago. Therefore, technical analysis is bullish.
Summary: Both seasonality and technical were bullish so the trade was entered 3 weeks ago. The price was 62.61. Today, the price today. 67.62. This is a winning trade.
CONCLUSION
4 trades were posted on social media for earnings this week. 1 was a loser, 2 winners and 1 no take. This was using a simple method for predication of earnings. For each trade, you looked for a reward/risk of 3:1, you are profitable now.
For example, if you assumed risk per trade is $200 and reward/risk of 3:1 then here is a summary:
1 loss: -200usd
2 winners: 200*3*2 = 1200usd
Net p&L: 1000usd
CFTC RULE 4.41 – HYPOTHETICAL OR SIMULATED PERFORMANCE RESULTS HAVE CERTAIN LIMITATIONS. UNLIKE AN ACTUAL PERFORMANCE RECORD, SIMULATED RESULTS DO NOT REPRESENT ACTUAL TRADING. ALSO, SINCE THE TRADES HAVE NOT BEEN EXECUTED, THE RESULTS MAY HAVE UNDER-OR-OVER COMPENSATED FOR THE IMPACT, IF ANY, OF CERTAIN MARKET FACTORS, SUCH AS LACK OF LIQUIDITY, SIMULATED TRADING PROGRAMS IN GENERAL ARE ALSO SUBJECT TO THE FACT THAT THEY ARE DESIGNED WITH THE BENEFIT OF HINDSIGHT. NO REPRESENTATION IS BEING MADE THAT ANY ACCOUNT WILL OR IS LIKELY TO ACHIEVE PROFIT OR LOSSES SIMILAR TO THOSE SHOWN. Testimonials appearing on this site are actually received via email submission. They are individual experiences, reflecting real life experiences of those who have used our products and/or services in some way or other. However, they are individual results and results do vary. We do not claim that they are typical results that consumers will generally achieve. The testimonials are not necessarily representative of all of those who will use our products and/or services. The testimonials displayed are given verbatim except for correction of grammatical or typing errors. Some have been shortened, meaning; not the whole message received by the testimony writer is displayed, when it seemed lengthy or the testimony in its entirety seemed irrelevant for the general public.
Options Characteristics & Risks of Standardized Options. <a href=”http://www.optionsclearing.com/components/docs/riskstoc.pdf”>Click here to download</a>.
https://www.imtftrade.com is owned and operated by and may contain advertisements, sponsored content, paid insertions, affiliate links or other forms of monetization.
https://www.imtftrade.com abides by word of mouth marketing standards. We believe in honesty of relationship, opinion and identity. The compensation received may influence the advertising content, topics or posts made in this blog. That content, advertising space or post will be clearly identified as paid or sponsored content.
is never directly compensated to provide opinion on products, services, websites and various other topics. The views and opinions expressed on this website are purely those of the authors. If we claim or appear to be experts on a certain topic or product or service area, we will only endorse products or services that we believe, based on our expertise, are worthy of such endorsement. Any product claim, statistic, quote or other representation about a product or service should be verified with the manufacturer or provider.
This site does not contain any content which might present a conflict of interest.
makes no representations, warranties, or assurances as to the accuracy, currency or completeness of the content contain on this website or any sites linked to or from this site.
Contact
If you have any questions regarding this policy, or your dealings with our website, please contact us he info@eiicapital.com


