
The markets have been very interesting lately. With little volume, the market has been moving up.
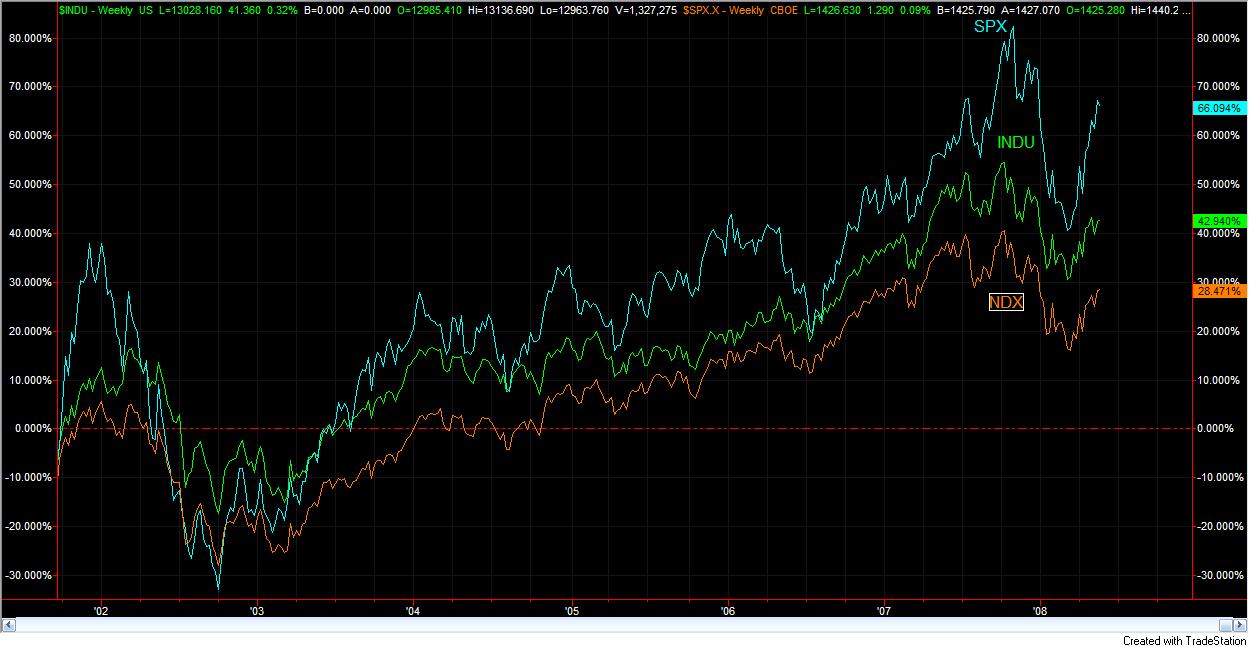
Below is a percentage based chart of the SPX,NDX, and the DJX. Ignore the percentage values and just observe the chart formation. The chart formation shows that when the markets have been going up, the SPX has been leading. When the markets have been going bearish, the NDX/DJX have been leading the way. However, the SPX drops at a higher percentage then the Dow during the down move.
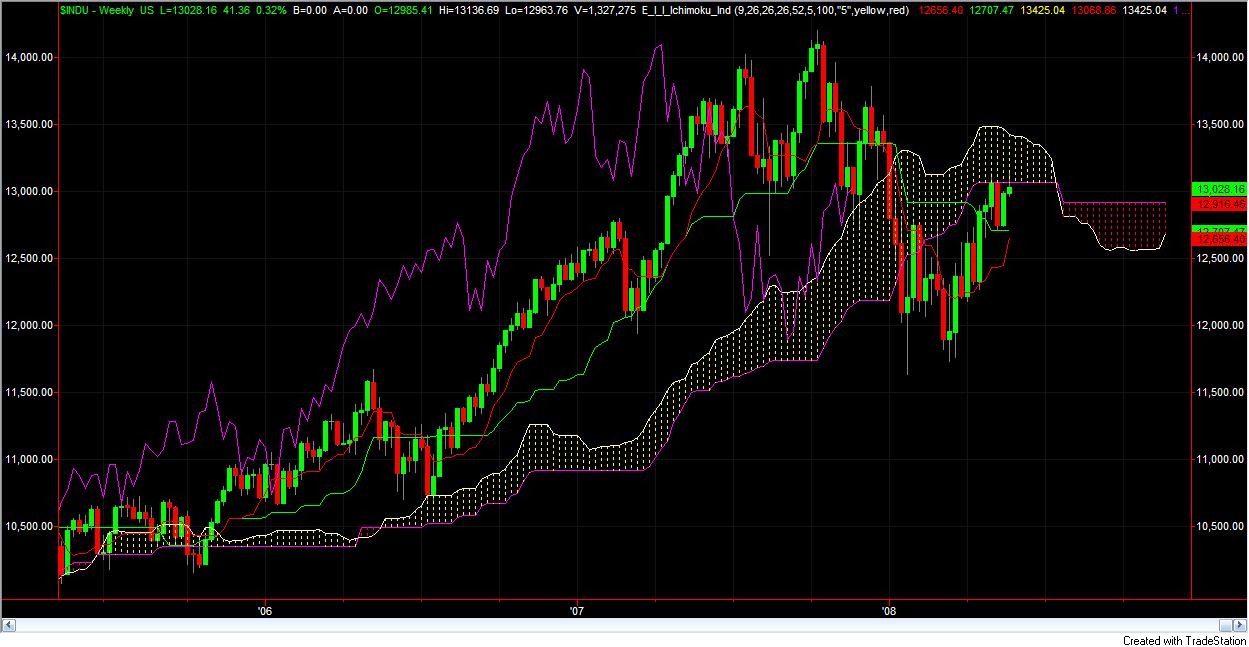
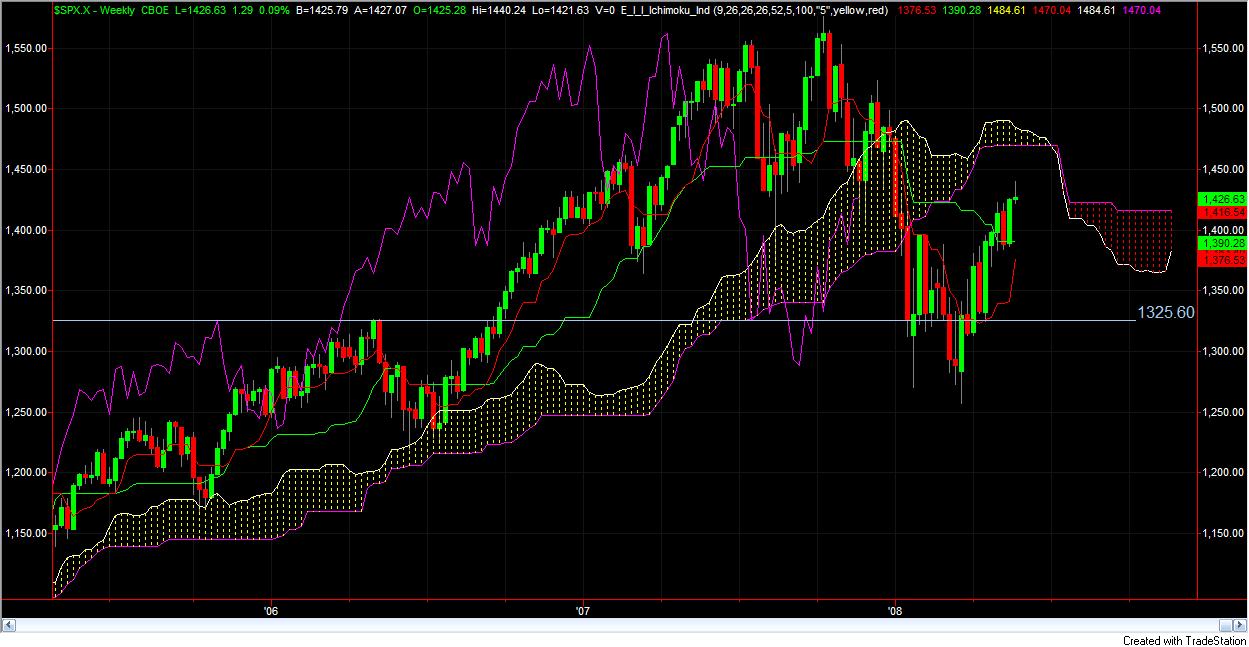
Below are the weekly chart for the Dow and the SPX. For both indexes, price is below the kumo cloud indicating the longer term sentiment as being bearish. However, last week’s price action caused the Tenkan Sen(red) to move toward the Kijun Sen(green) causing a bullish movement to occur between the Tenkan/Kijun Sen relationship. The other indicators are moving towards a bullish sentiment too. Therefore, we are current bearish but the indicators are moving to a bullish sentiment. With a little pull back where price and Tenkan Sen meet up, a long term bullish movement COULD possible take place. Only time will tell us if this will happen. At this time, there is no long term trend.
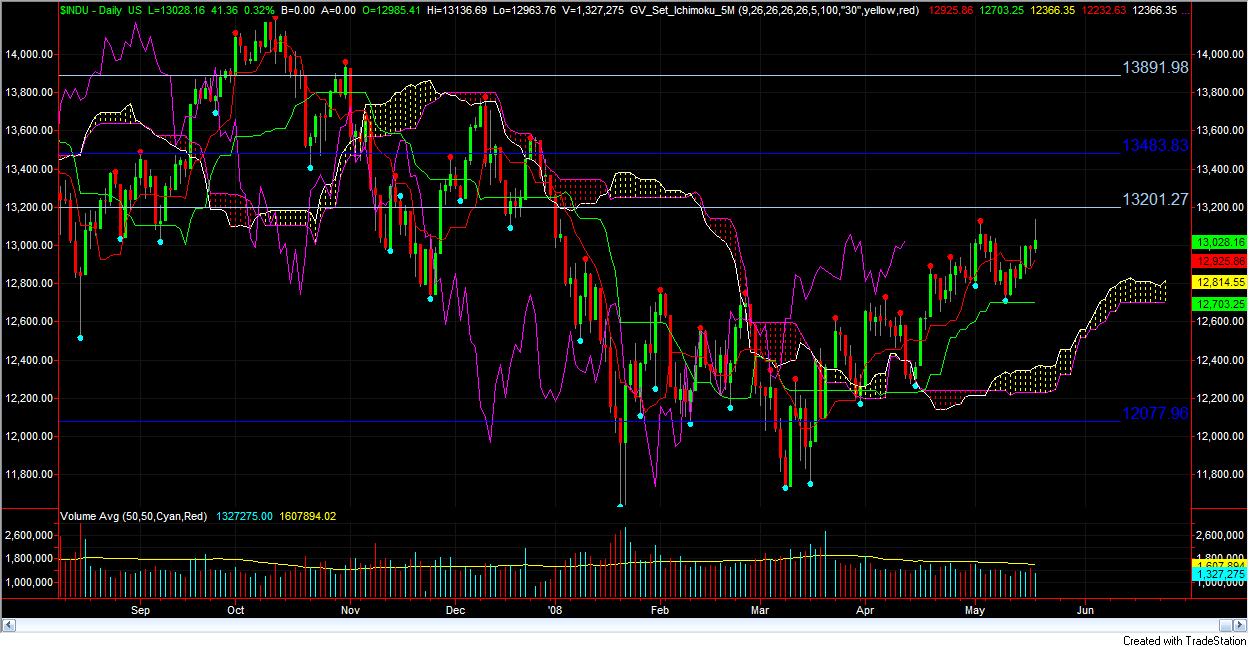
Below is the daily chart for the Dow and the SPX. They are both in a bullish trend. However, there is a lot of resistance in both charts for the trend.

In conclusion, the weekly and the daily are conflicting. This may cause consolidation. This is not an idle scenerio to trade.
For EDUCATIONAL USE. Commodity Futures Trading Comission, Forex, Futures, Equity and options trading has large potential rewards, but also large potential risk and may not be suitable for everyone. You must be aware of the risks and be willing to accept them in order to invest in these markets. Do not trade with money you can not afford to lose. This is neither a solicitation nor an offer to Buy/Sell. No representation is being made that any account will or is likely to achieve profits or losses similar to those discussed on this document. The past performance of any trading system or methodology is not necessarily indicative of future results. All information provide d on the Blog is for educational purpose
")