
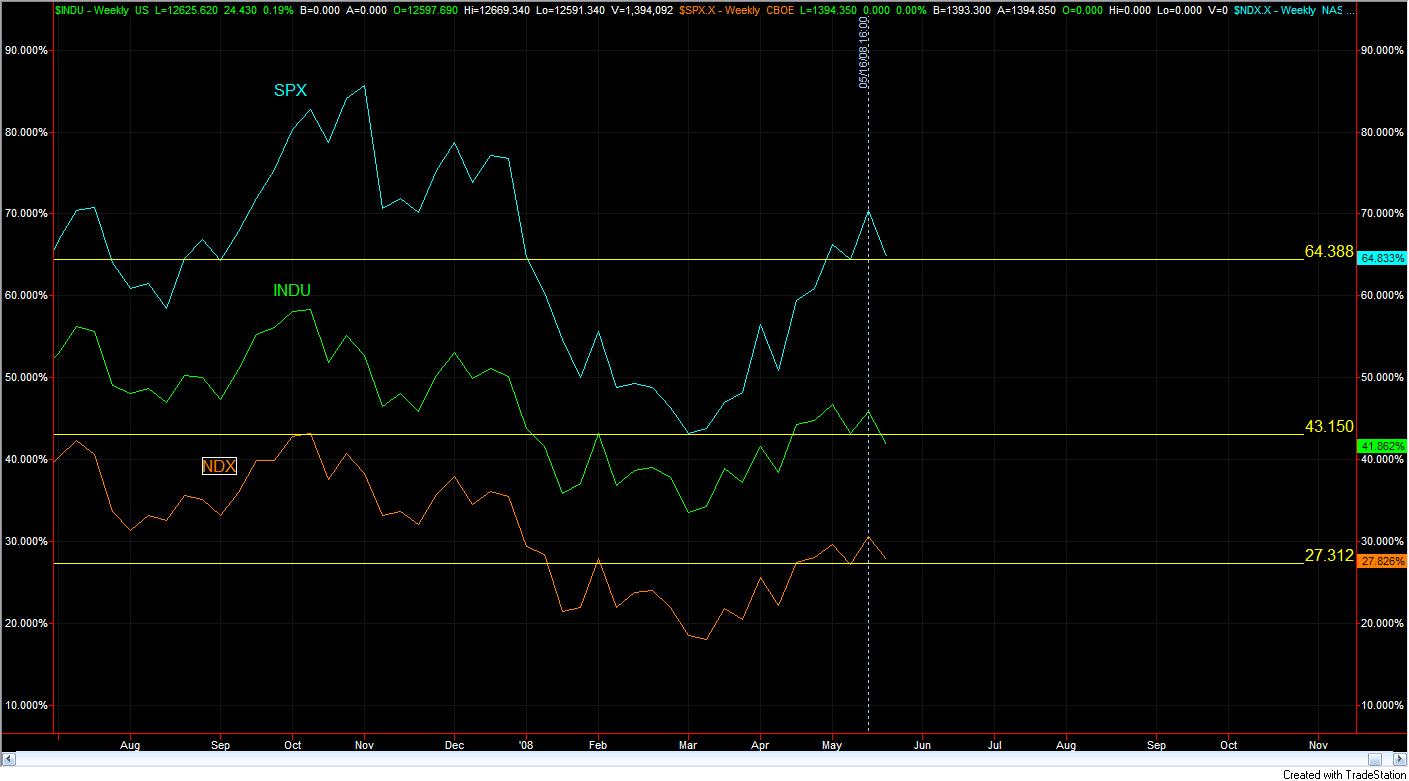
Below is the Percentage change chart for all three markets: SPX, DJX, NDX. On the chart, we have drawn a horizontal line at the last low “pivot” point. Notice, the SPX and NDX are close to touching it but the Dow has already gone past this mark. It is moving to the next low “pivot” point. This chart shows the Dow is more bearish at this point then the other two markets.
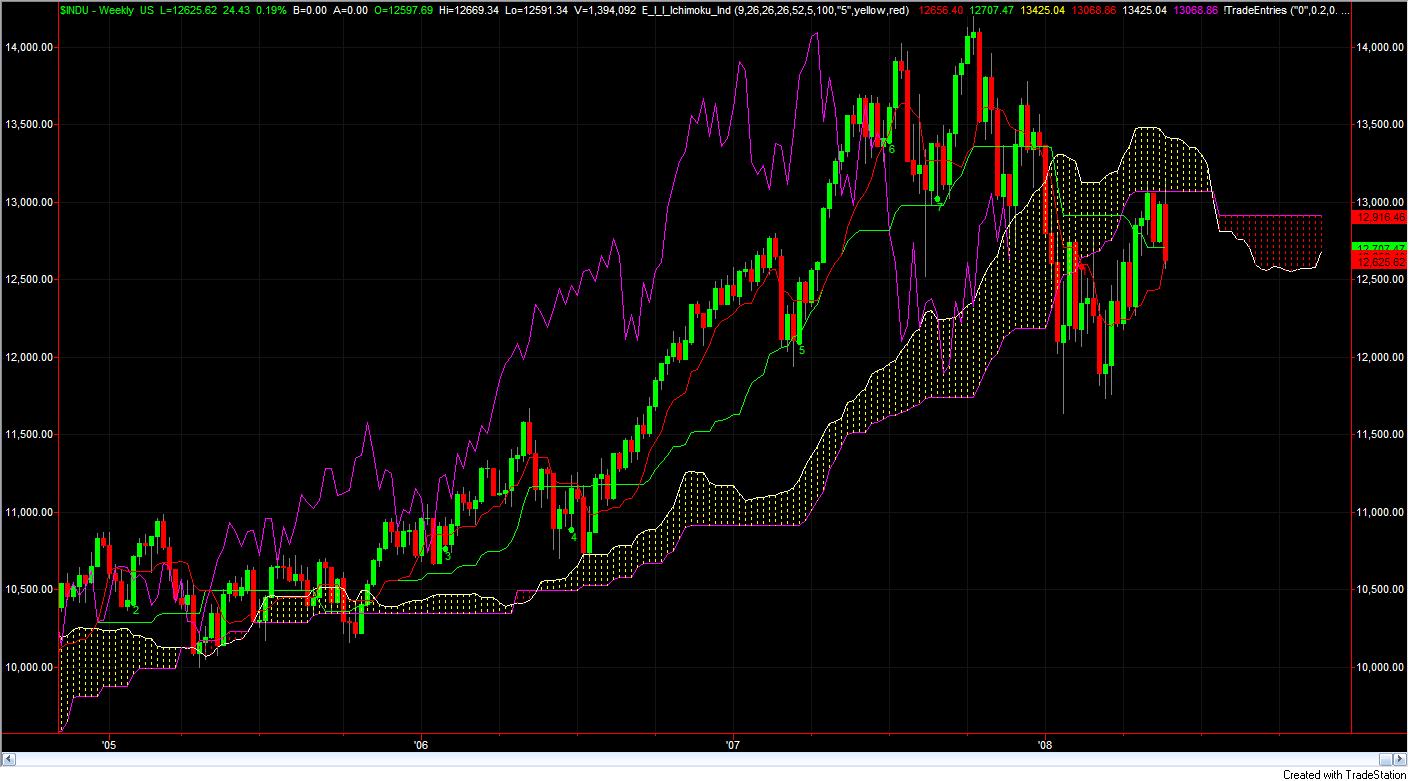
Let’s analyze the weekly charts for both the Dow and the SPX to see what is happening long term. Below is the weekly chart for both the SPX and the Dow. For both weekly charts, price needed to “equalize” last week since it had moved up too fast in a too short of a time. This week, price price equalized to a point where the tenkan/kijun sen are now close to price. Both charts still show that the weekly chart pattern is bearish. However, it is weakening with time. Since the charts are weakening, there really is NO trend at this time for either the SPX and the DJX for a long term basis. One difference between the DJX and the SPX is that on the chart for the DJX, price is now touching the Tenkan Sen whereas the SPX price still has more movement to go to touch the Tenkan Sen.

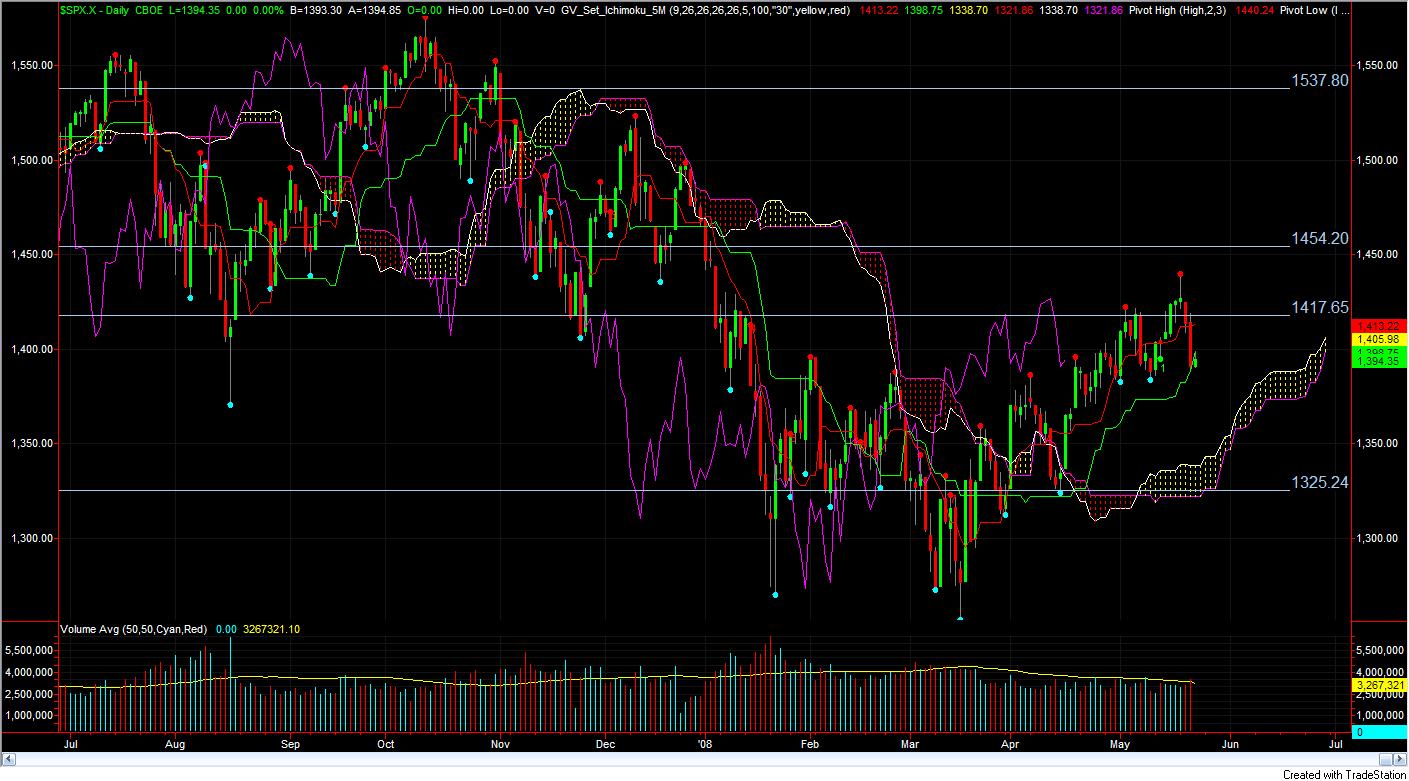
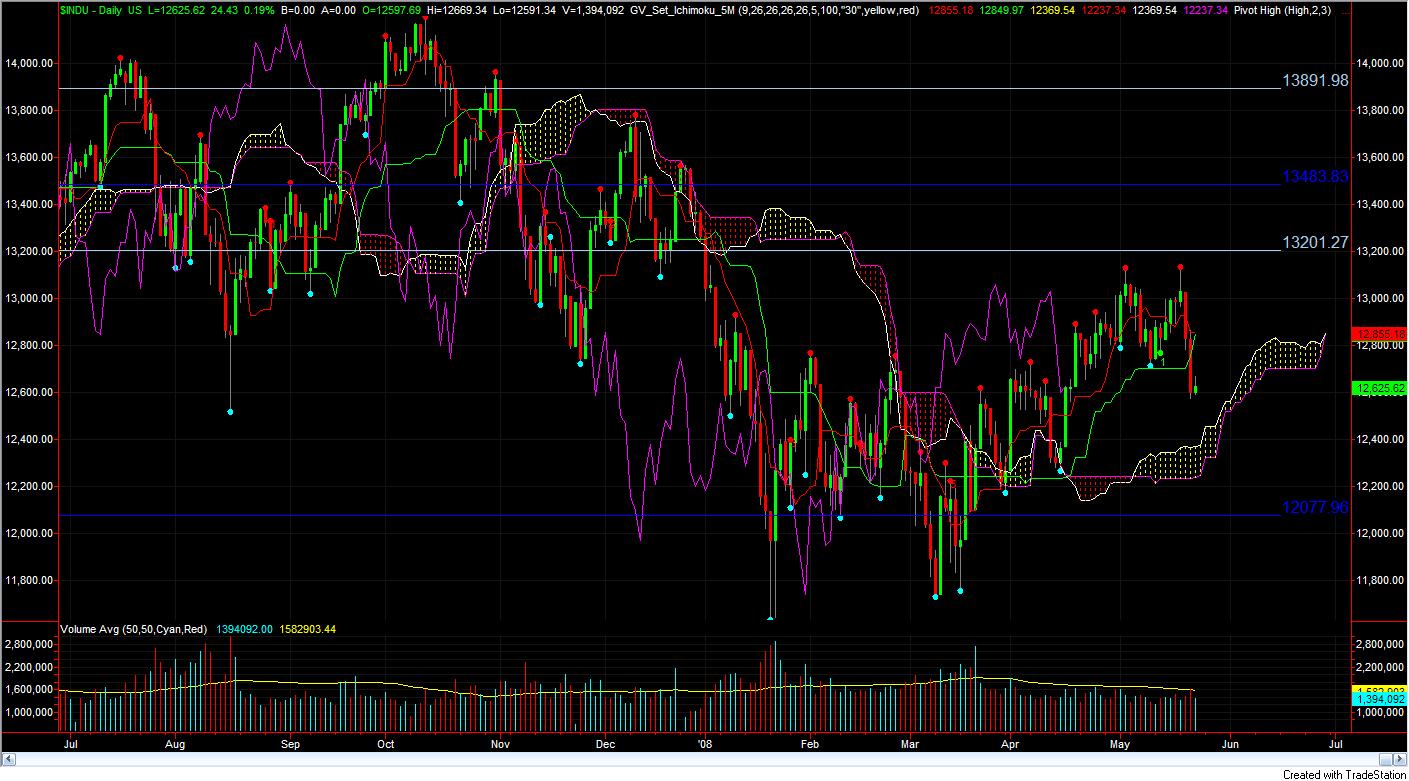
Below are the daily charts for both the SPX and the DJX. On both charts, price has now moved below the Kijun Sen. Also, price has moved too far away from the Tenkan Sen to a point where it will need to equalize at same time. A little up movement can equalize price and the tenkan sen. The main difference between the two charts is that on the DJX daily chart, the tenkan/Kijun relationship is also showing bearish signs whereas on the SPX it is not showing this at all yet.
If you are a trend trader, there are no trades at this time. There is too much conflicts in price between markets, timeframes, etc. At this time, the only thing we have noticed is that the SPX is more bullish then the DJX. The DJX is leading the way on the down movement.
For EDUCATIONAL USE. Commodity Futures Trading Comission, Forex, Futures, Equity and options trading has large potential rewards, but also large potential risk and may not be suitable for everyone. You must be aware of the risks and be willing to accept them in order to invest in these markets. Do not trade with money you can not afford to lose. This is neither a solicitation nor an offer to Buy/Sell. No representation is being made that any account will or is likely to achieve profits or losses similar to those discussed on this document. The past performance of any trading system or methodology is not necessarily indicative of future results. All information provide d on the Blog is for educational purpose
")