
The market is very interesting right now with people citing we are already in a recession. Some people are stating that we have already formed the “bottom” and the market is just consolidating and eventually will go up. Which statement is true if any? Let’s analyze the charts to see if any of these statements are true.
For the analysis, we first need to determine roughly where possible the bearish trend may end. In order to do this, we are going to look at the past to determine past percentage movements in price. History typically repeats itself.
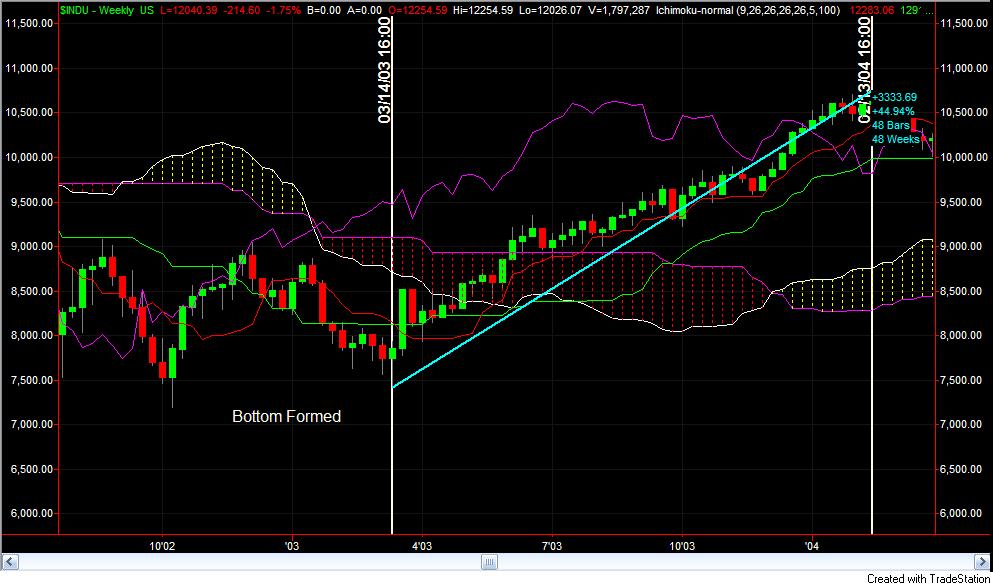
Below is the weekly chart for $INDU for early 2003 when the market formed the “bottom”. On 3/14/2003, the market started to move up and continued until 2/13/04. The percentage movement for this bullish movement after reaching the bottom was roughly 44.9% in 48 weeks.
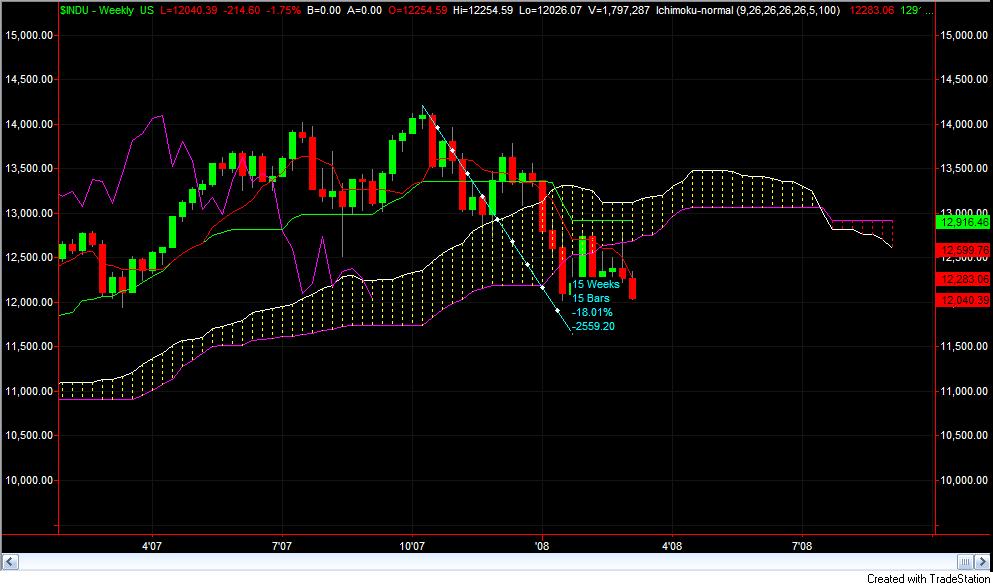
Now, we are going to analyze what is happening to the market today. First, we have to make an assumption that the market top for $Indu was reached on 10/12/2007. With this assumption, we calculate the percentage movement for price to the lowest price after 10/12/2007. The lowest price was reached on 1/25/2008. This is a 18% movement in 15 weeks.
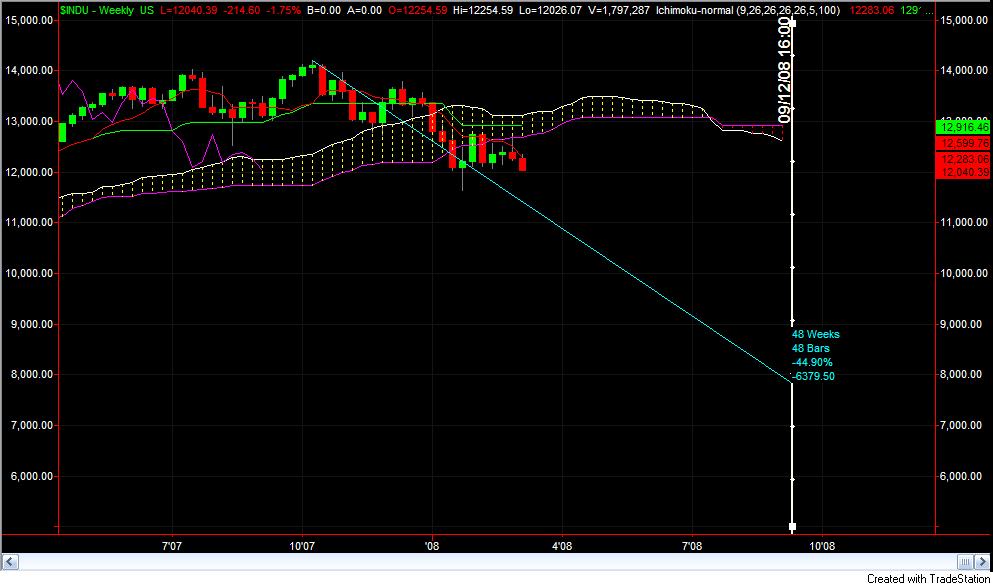
In 2003, we moved 44.9%. Fifty percent of this value is 22.45% in 24 weeks. Therefore, if today’s price action moves 50% of the percentage movement from what was seen in 2003, we will form a “bottom” roughly around 11044.56 by 03/28/08. If today’s price action moves 100% of the percentage movement from what was seen in 2003, we will form a “bottom” roughly around 7868.17 by 09/12/08.
Today, we closed lower then the last low. With this movement, we see signs of a possible bearish trend developing on a weekly basis. The trend will be confirmed if we close below 11735.08. If we break this value then there is a very high probability according to the charts that we will go to 11044.56 because a bearish trend would have developed.
Only time will tell if history will repeat itself.
For EDUCATIONAL USE. Commodity Futures Trading Commission, Forex, Futures, Equity and options trading has large potential rewards, but also large potential risk and may not be suitable for everyone. You must be aware of the risks and be willing to accept them in order to invest in these markets. Do not trade with money you can not afford to lose. This is neither a solicitation nor an offer to Buy/Sell. No representation is being made that any account will or is likely to achieve profits or losses similar to those discussed on this document. The past performance of any trading system or methodology is not necessarily indicative of future results. All information provide d on the Blog is for educational purpose .
")