
I am finally back from vacation. Great to be back. It has been interesting to see the charts.
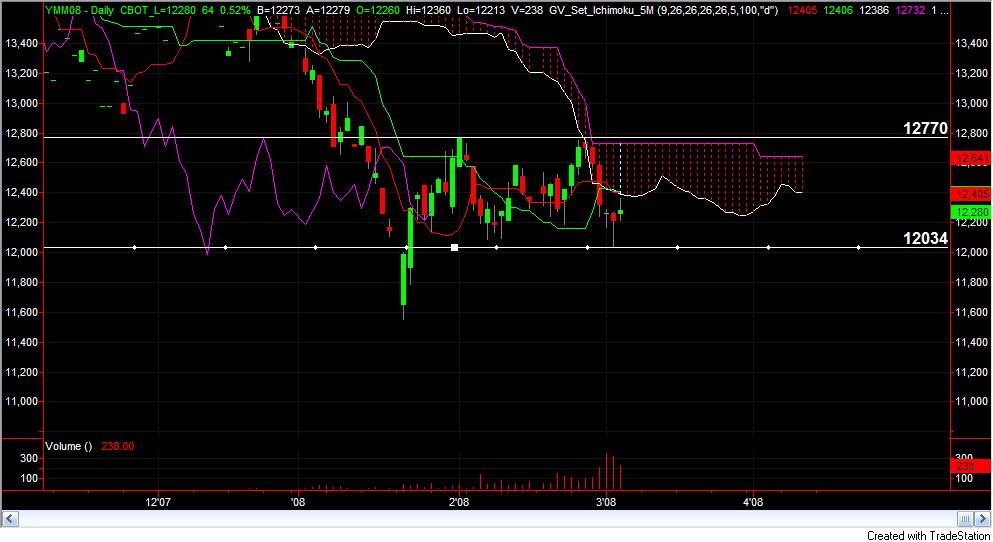
Let’s look at the daily chart on the Mini-Dow futures. On Jan 21, the futures entered a trading range. This is shown in the graph below. Since we are in a trading range, there is no real long term trade. As a result, we are going to look for a quick swing trade. Remember, the daily shows the charts are in a bearish sentiment. This sentiment can only change if price suddenly closes above 12406. Therefore, we will look for a bearish swing trade.
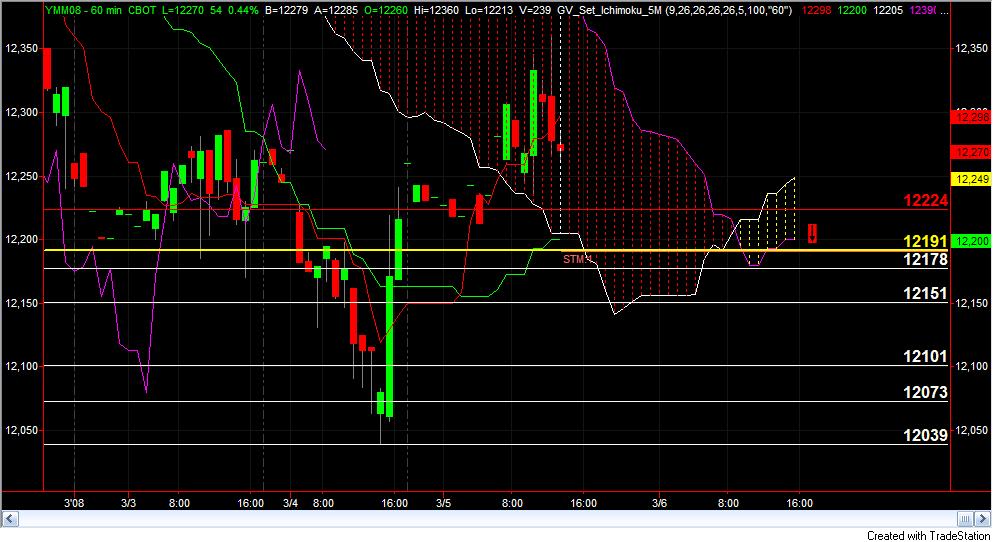
Below is the 60 minute chart for the mini-Dow futures. The yellow line outlines the entry for a bearish swing trade and the red line outlines the stop for the trade. We are keeping our stops tight due to the volatility in the market but no too tight where we can get stopped out of the trade easily. The white lines indicates possible price targets
For EDUCATIONAL USE. Commodity Futures Trading Commission, Forex, Futures, Equity and options trading has large potential rewards, but also large potential risk and may not be suitable for everyone. You must be aware of the risks and be willing to accept them in order to invest in these markets. Do not trade with money you can not afford to lose. This is neither a solicitation nor an offer to Buy/Sell. No representation is being made that any account will or is likely to achieve profits or losses similar to those discussed on this document. The past performance of any trading system or methodology is not necessarily indicative of future results. All information provide d on the Blog is for educational purpose .
")