
A lot of people are wondering, what happened today? Well, insitututions started to cover their long positions in the last 90 minutes of the day.
Below is a full technical analysis of the $SPX. It may be too technical for some people.
First, let’s look at the VIX. Below is the VIX from today. Today, we are the .618 Fib value. This is a very critical value. If VIX goes higher tomorrow (market goes down) then we are moving to the next level which is .707.
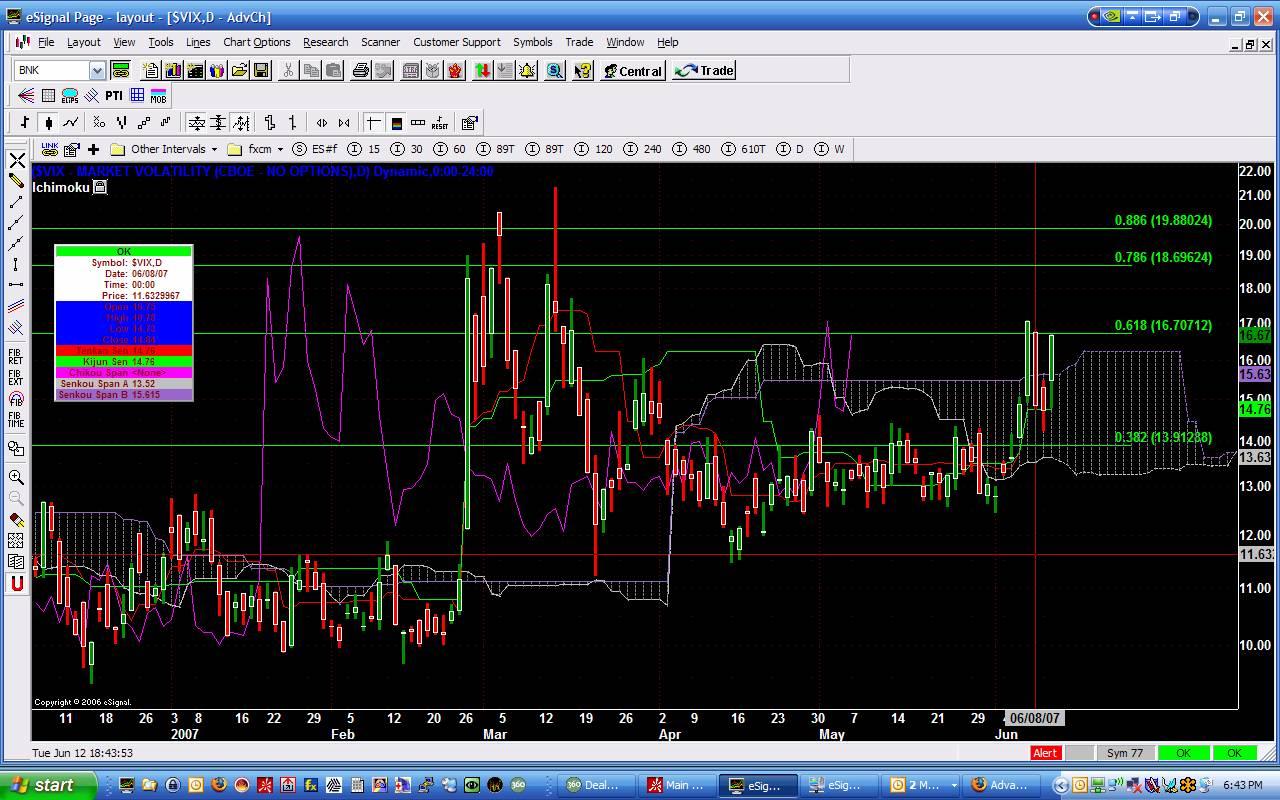
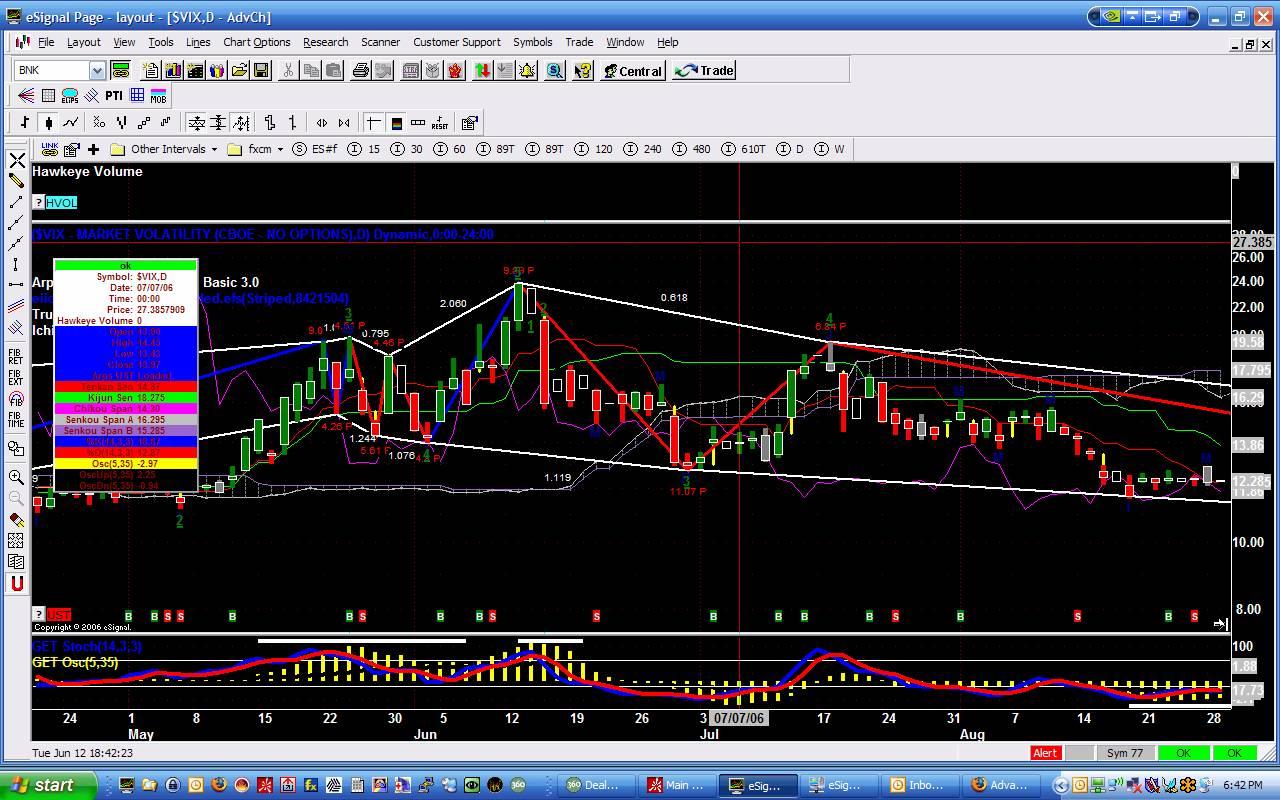
Below is the VIX from last year. The patterns are very similar to the VIX pattern of this year. One difference is the price value. That is ok. Noice, the huge VIX drop that occurs on the Thursday before their option expiry.
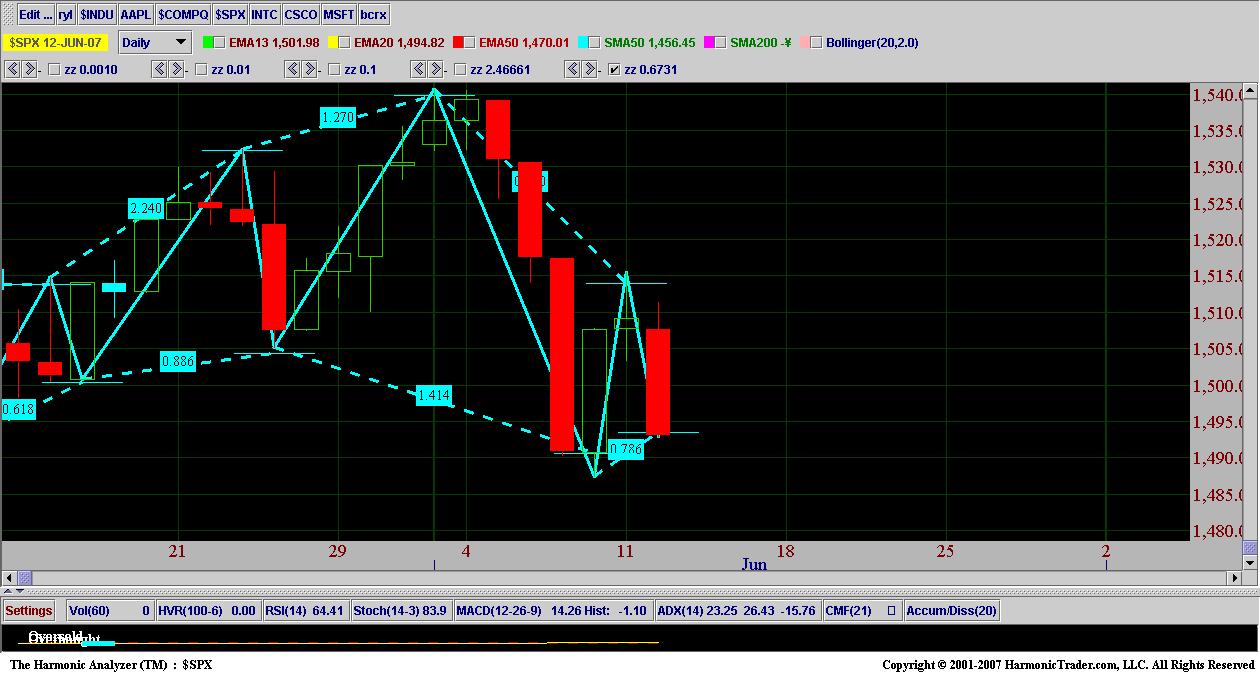
Let’s look at Harmonic Analyzer chart. Today’s down movement went right to the Fib value of .786. We could bounce tomorrow or go lower to the next Fib value of .886
The seasonal chart (not predictive of future results) shows us that we are going down until 6/14. At that point price will move up and then consolidate into the end of next week. However, before the end of the month, we will go lower then 6/5. This week and next week is the minor pull back before the final bearish run.
Finally, lets look at the charts. Up to this point, all our analysis has shown that tomorrow is a key day. If we go lower tomorrow, we will go to the next Fib value with the possibility of being able to go lower then the low from 6/5. However, history shows that Thursday/Friday, the market makes it move up. This is probably due to option expiry.
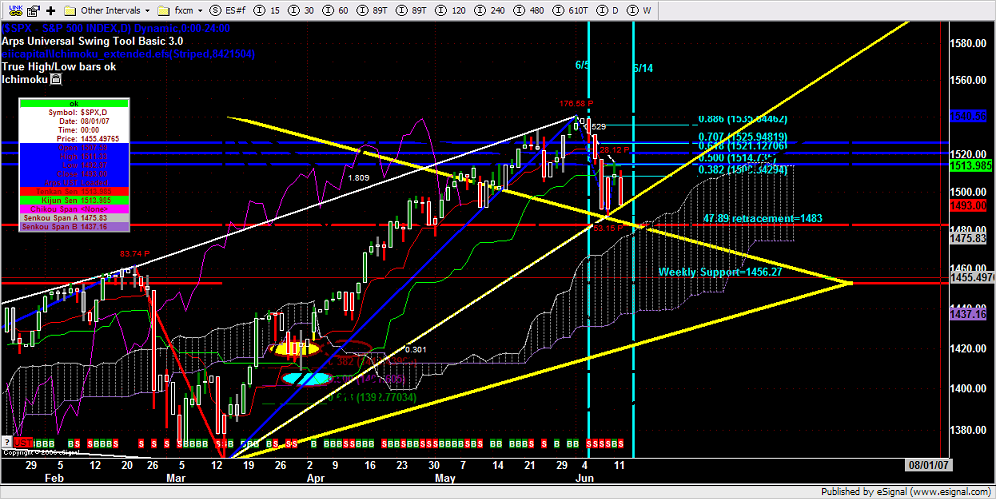
Below, are the $SPX analysis. The yellow lines are Gann lines. It is interesting how price is closing right at a yellow Gann line. If price breaks through the yellow Gann line then we will go to the next Gann line which is at 1483. 1483 is going to be a very critical point. It is going to determine if we continue with a bullish trend or enter neutral. The date 6/14 represents where the market typically moves up.
So is there a trade? At this time, it is too risky for a trade. Let’s see what happens tomorrow.
For EDUCATIONAL USE. Commodity Futures Trading Commission, Forex, Futures, Equity and options trading has large potential rewards, but also large potential risk and may not be suitable for everyone. You must be aware of the risks and be willing to accept them in order to invest in these markets. Do not trade with money you can not afford to lose. This is neither a solicitation nor an offer to Buy/Sell. No representation is being made that any account will or is likely to achieve profits or losses similar to those discussed on this document. The past performance of any trading system or methodology is not necessarily indicative of future results. All information provide d on the Blog is for educational purpose .
")