
Just like our seasonal charts suggested today was a down day. The next possible “turn” dates are 6/12 & 6/16 (+-2 days).
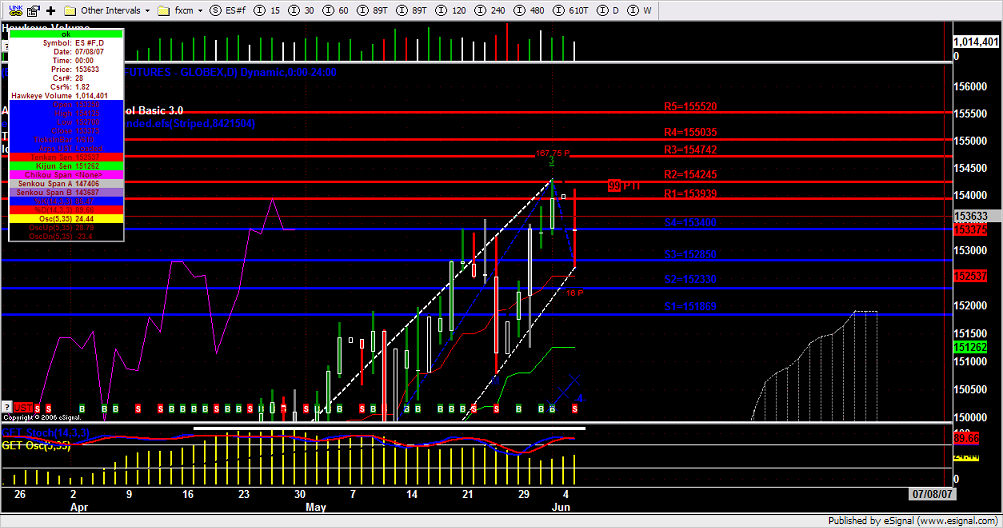
Let’s analyze the charts. The charts show there is still a bullish sentiment. The bullish trend is now in a consolidation mode. The consolidation mode will only turn back into a trend if we close above the R2 value. Only if this happens, will momentum pick back up for the trend to continue.
If price closes below 151252 then the bullish trend is most likely over. That is a huge drop if it occurs.
On the chart, I have drawn all the support/resistance values. If we close above R5 then we will have no resistance lines anymore since we would have reached the all time high of the S&P. Once we close above R5, we will use Fib values to determine resistance values.
For EDUCATIONAL USE. Commodity Futures Trading Commission, Forex, Futures, Equity and options trading has large potential rewards, but also large potential risk and may not be suitable for everyone. You must be aware of the risks and be willing to accept them in order to invest in these markets. Do not trade with money you can not afford to lose. This is neither a solicitation nor an offer to Buy/Sell. No representation is being made that any account will or is likely to achieve profits or losses similar to those discussed on this document. The past performance of any trading system or methodology is not necessarily indicative of future results. All information provide d on the Blog is for educational purpose .
")