
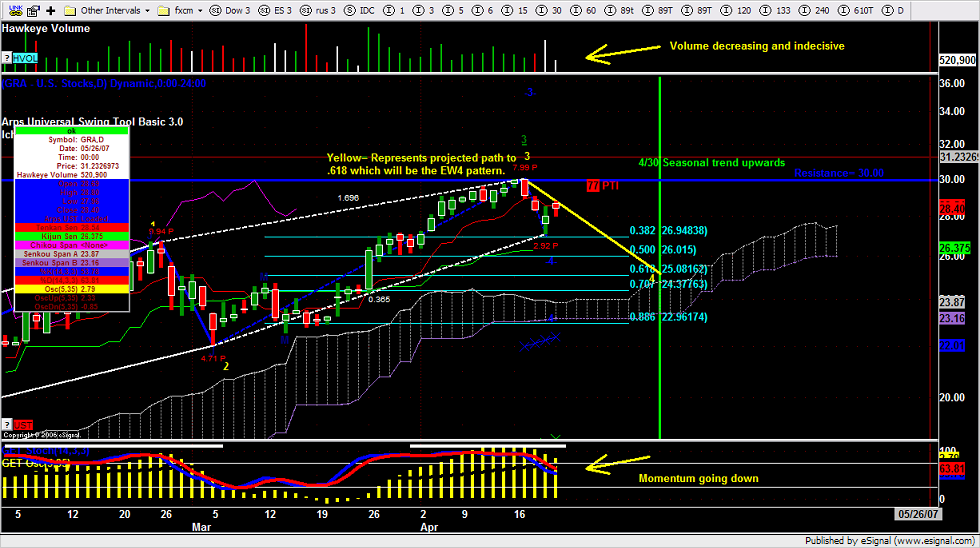
Below is the analysis for the equity: GRA. GRA is following a Elliott Wave pattern. Right now, a correction is taking place so the EW4 is being formed.
The Esignal chart shows the EW pattern along with the projected EW4 pattern formation along with the completion date. The completion date was obtained from the seasonal software.
The HA analysis is shown below:
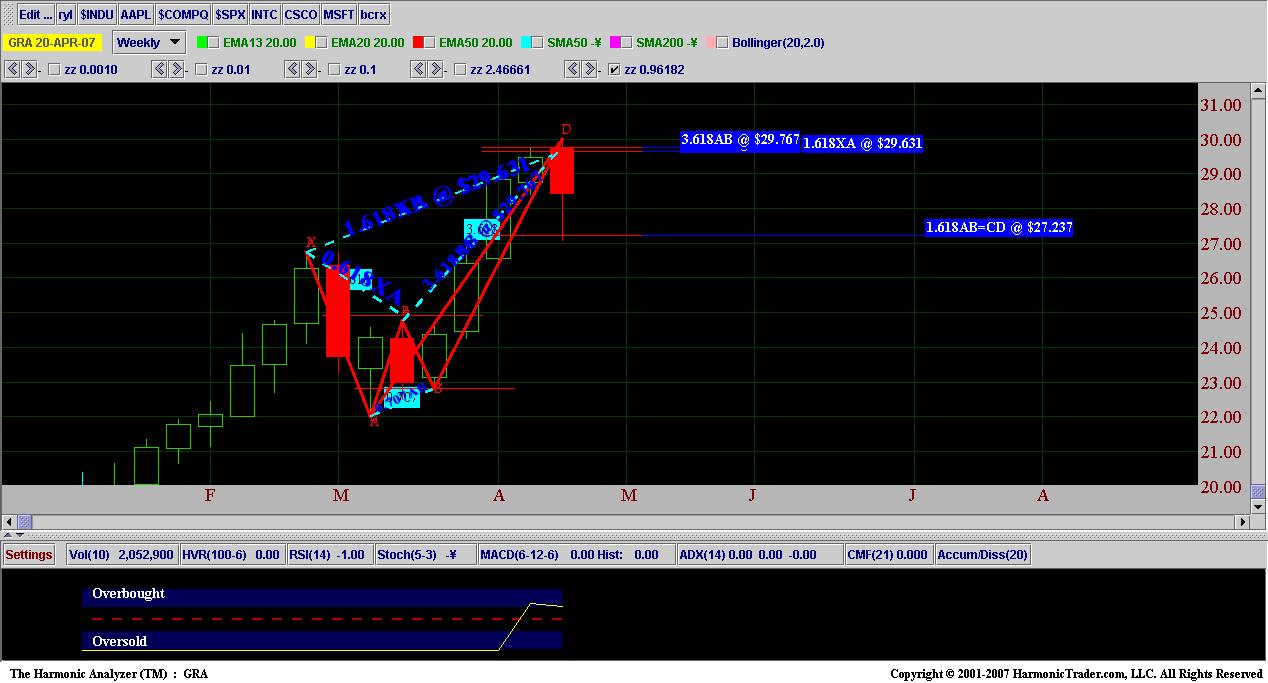
Two possible trades exist. They are as follows:
- Bearish EW4:
- Entry: 28.40
- Stop: 30.05
- Target: 26.01 (50%) and 25.08 (50%)
- Bullish EW5:
- Entry 25.08
- Stop: 24.30
- Target: 28.78 (50%) and 30.00 (50%)
For EDUCATIONAL USE. Commodity Futures Trading Commission, Forex, Futures, Equity and options trading has large potential rewards, but also large potential risk and may not be suitable for everyone. You must be aware of the risks and be willing to accept them in order to invest in these markets. Do not trade with money you can not afford to lose. This is neither a solicitation nor an offer to Buy/Sell. No representation is being made that any account will or is likely to achieve profits or losses similar to those discussed on this document. The past performance of any trading system or methodology is not necessarily indicative of future results. All information provide d on the Blog is for educational purpose .
")