
The Fed announced yesterday another .25 point cut. Initially, the markets went up before the announcement and towards the end of the day, they close a little higher compared to the inter-day high.
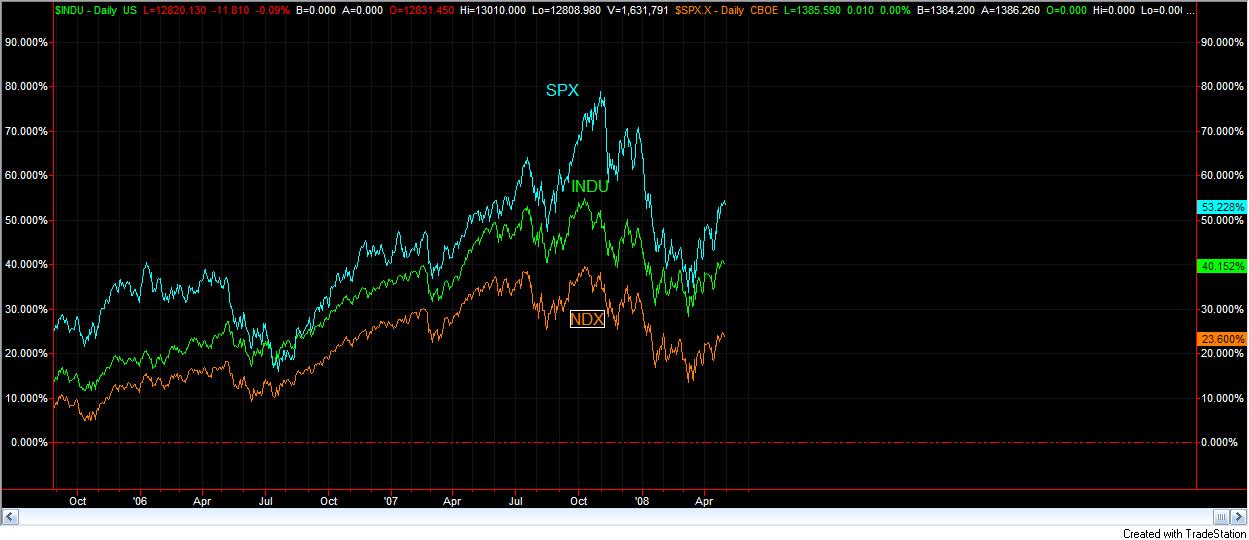
Let’s analyze the markets based on a technical view. Below is a percentage change chart for the Dow, NASDAQ, and the S&P. As you can see from the chart, the Dow has been “leading” the other two markets. Therefore, we are going to analyze the Dow further to see if we are in a bullish or bearish sentiment.
In order to determine the sentiment of the Dow, we are going to look at the weekly chart first. We are doing that because we want to get a “long term” view of the market especially with all the volatility we have had this year. Below is the weekly chart for the Dow. From the chart, you can see that price is still below the Kumo Cloud which indicates that the weekly timeframe for the Dow is in a bearish sentiment. All the other Ichimoku indicators are still bearish too so there is no really sign on us moving to a bullish sentiment as of yet since none of the indicators are bullish. If price gets to 13381 then we may be changing sentiment but until then the “long” term view is still bullish. The up move we have had in the month of April can be viewed as a pull back. In fact, yesterday’s high was at the 50% pullback from the high of 14198 to the low of 11634.

Now, let’s look at the daily timeframe. Unlike, the weekly chart of the Dow, the sentiment is bullish. However, there is a lot of resistance price will meet in order to keep on moving up. Also, with a 100-200 pt move, the sentiment could easily change. With the volatility, a 100-200 point move could happen in one day.
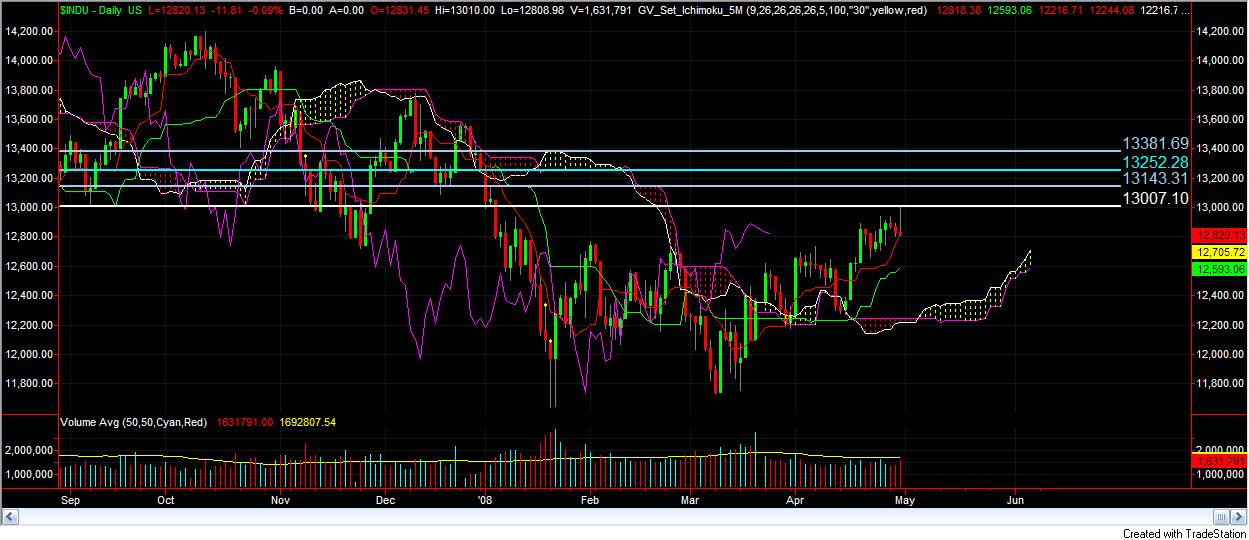
Due to the weekly timeframe, our sentiment is still bearish. As a result, we will be looking for our daily timeframe to move into a bearish sentiment before looking at any trades. We do not want to trade against the trend at all. The weekly and the daily timeframes are in conflict.
For EDUCATIONAL USE. Commodity Futures Trading Commission, Forex, Futures, Equity and options trading has large potential rewards, but also large potential risk and may not be suitable for everyone. You must be aware of the risks and be willing to accept them in order to invest in these markets. Do not trade with money you can not afford to lose. This is neither a solicitation nor an offer to Buy/Sell. No representation is being made that any account will or is likely to achieve profits or losses similar to those discussed on this document. The past performance of any trading system or methodology is not necessarily indicative of future results. All information provide d on the Blog is for educational purpose
")