
We are going to analyze the chart for the INDU and also the Dow futures. The reason is that they look different.
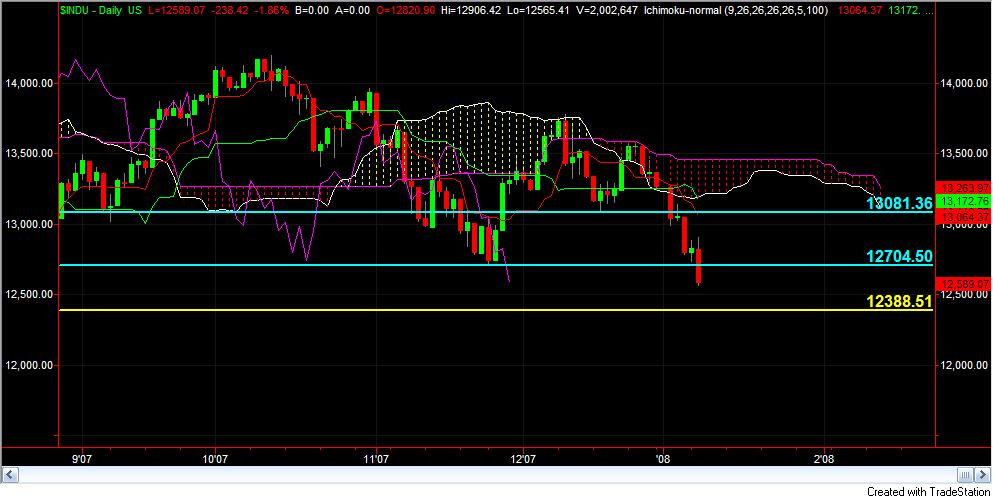
Below is a chart for the INDU. For the INDU, a bearish trend started today. The 12704.50 would have been a great point to sell out. Since we did not blog it, we are going to move on. We are now going to look at a buying opportunity. Next week, the financial are going to announce earnings so it should get very interesting. Our buy is another 200 points down at 12388.51. We will determine the stop before we get into the trade.
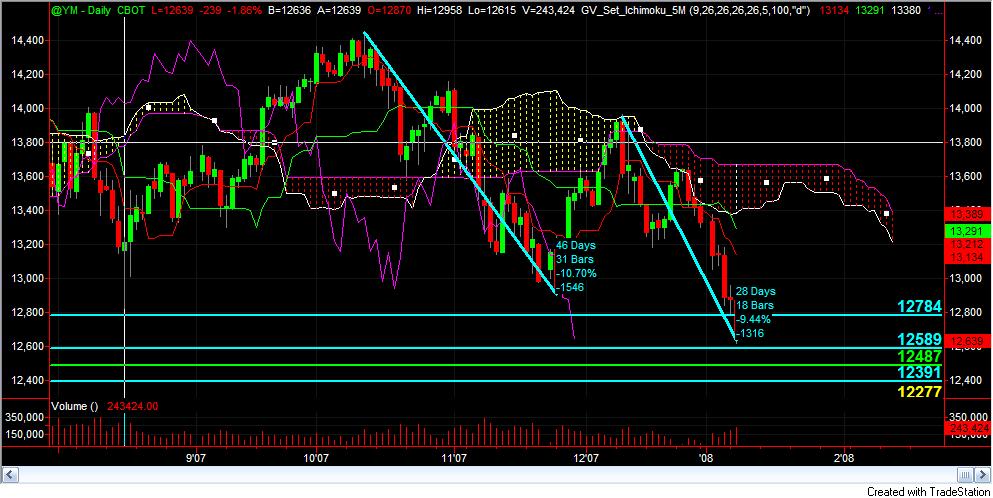
Below is the chart for the dow future. Today, we have moved a total of 9.44% down from December high. From the October high to the December low, we moved a total of 10.70%. If we match the last down movement, the Dow should move to 12487 (green line). Therefore, we can place a buy order at this value with a stop of 12391. Another major support area is 12277 so this could be another buying point. We will wait and see what happens.
For EDUCATIONAL USE. Commodity Futures Trading Commission, Forex, Futures, Equity and options trading has large potential rewards, but also large potential risk and may not be suitable for everyone. You must be aware of the risks and be willing to accept them in order to invest in these markets. Do not trade with money you can not afford to lose. This is neither a solicitation nor an offer to Buy/Sell. No representation is being made that any account will or is likely to achieve profits or losses similar to those discussed on this document. The past performance of any trading system or methodology is not necessarily indicative of future results. All information provide d on the Blog is for educational purpose .
")