
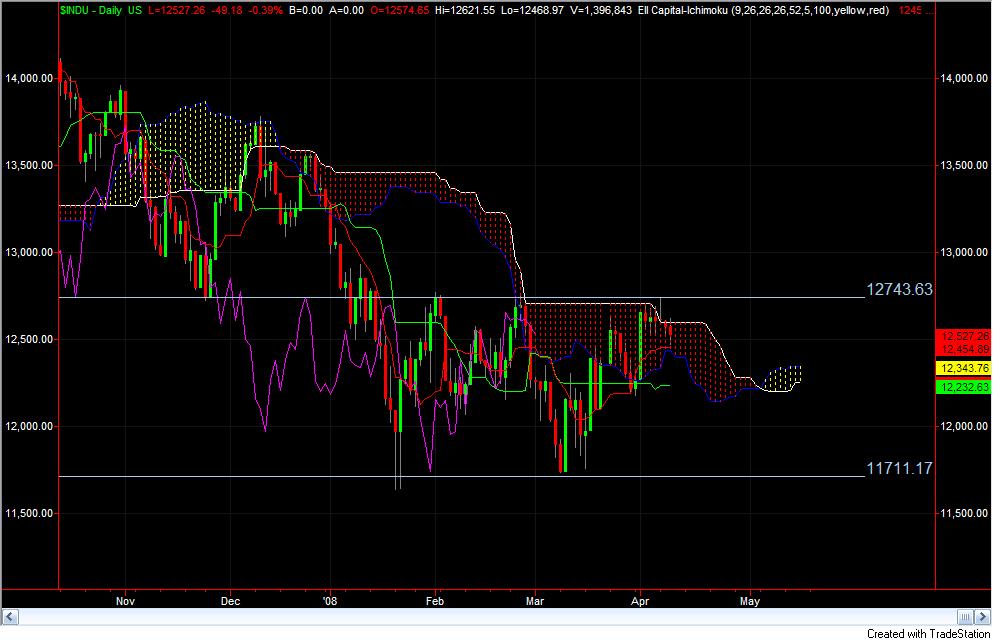
The magical question everyone is asking is are we bullish or bearish. Below is the daily Ichimoku chart for the INDU. The chart shows that price is within the Kumo cloud. As a result, we are consolidating i.e. neither bullish or bearish. With the Kijun Sen below the Kumo cloud, there is more a bearish “tilt” then a bullish “tilt”. Also, all the indicators still have to go through the Kumo cloud which will cause more consolidation. There is a high probability according to the indicators that we my move down instead of up.
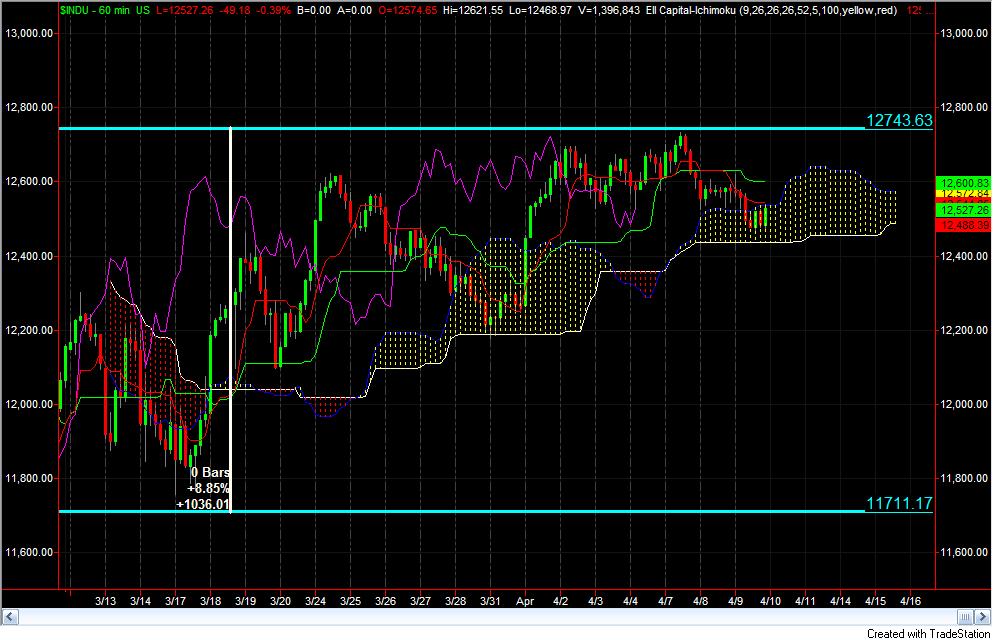
Below is the 60 minute chart. Price is within the Kumo cloud for the 60 minute too. Therefore, we will watch the 60 minute closely to see if it gives us an early signal of a bullish or bearish trade. Since 3.17, price has not broken below the Kumo Cloud. Therefore, in order for the sentiment to be bearish, we need to see price CLOSE below the Kumo cloud for a little while.
For EDUCATIONAL USE. Commodity Futures Trading Commission, Forex, Futures, Equity and options trading has large potential rewards, but also large potential risk and may not be suitable for everyone. You must be aware of the risks and be willing to accept them in order to invest in these markets. Do not trade with money you can not afford to lose. This is neither a solicitation nor an offer to Buy/Sell. No representation is being made that any account will or is likely to achieve profits or losses similar to those discussed on this document. The past performance of any trading system or methodology is not necessarily indicative of future results. All information provide d on the Blog is for educational purpose .
")