
In the last couple of days, Commodities have sold off drastically. So drastic that everyone thinks that the Commodity “Bull” run is over. Is it really over? Instead of listening to all the analysts, let’s see what the charts are telling us. We will us the Ichimoku Trend based system along with Volume to analyze various commodities.
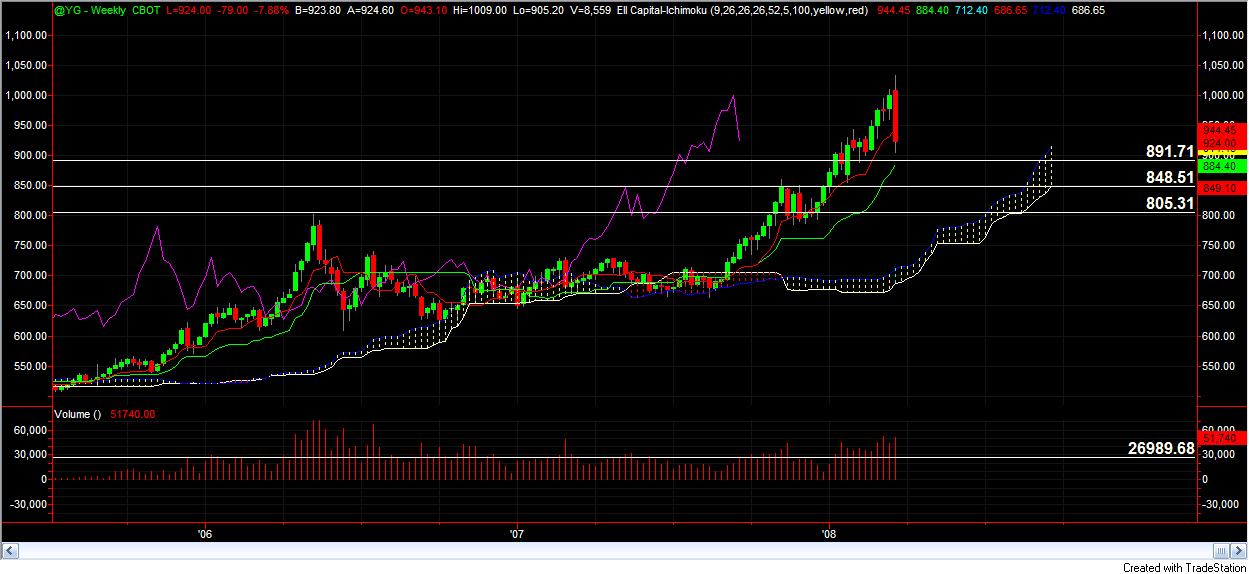
The first commodity we will look at is Gold, everyone’s favorite. As everyone knows, Gold hit an all-time high this week. For Gold, we will look at the E-Mini Gold Future contracts. Below is a weekly chart for the E-Mini-Gold Contracts. The charts has been compressed so you can see where the Gold bullish run really started (7/22/05). Notice the chart pattern. Initially, it started to move higher with a slow increase in volume. In the middle of 2006 to middle of 2007, it basically consolidated and then started to take off again. This week, Gold has moved down 11.92% from the all time high of 1033. The volume so far is 51,791. This is not the highest volume since 2005. Most analysts are saying that everyone is “rotating” out of commodities. From the volume, it seems like the down movement is profit taking. If a trader entered the E-Mini Gold contracts 8/17/07 and stayed in the contracts until the high, the percentage movement is 54.91%. This is huge percentage movement. On the first sign of a down movement, most traders probably decided to recognize profits because they DON’T want to give their profits back to the market. If you are a Elliott Wave trader, the chart pattern shows that the Elliott Wave 3 is over and the pull back Elliott Wave 4 is being formed. All the Ichimoku indicators are still “healthy” and still showing bullish sentiment. This is for a weekly timeframe (long term)
Below is a weekly chart for the Soybean Future contracts. Notice the volume as the trend started in 10/6/06. Since 10/6/06 to the high, the percentage movement was 192.35%. The down movement from the high has only been 24.03%. This seems like a “healthy” pull back too
.
Below is the weekly chart for Corn. Again, the chart looks similar to the Soybean chart. The Ichimoku indicators are healthy and are indicating that price needs to “equalize”. The Kijun Sen is at 457 2/8. Therefore, price has a high probability of getting close to this value before continuing the trend.

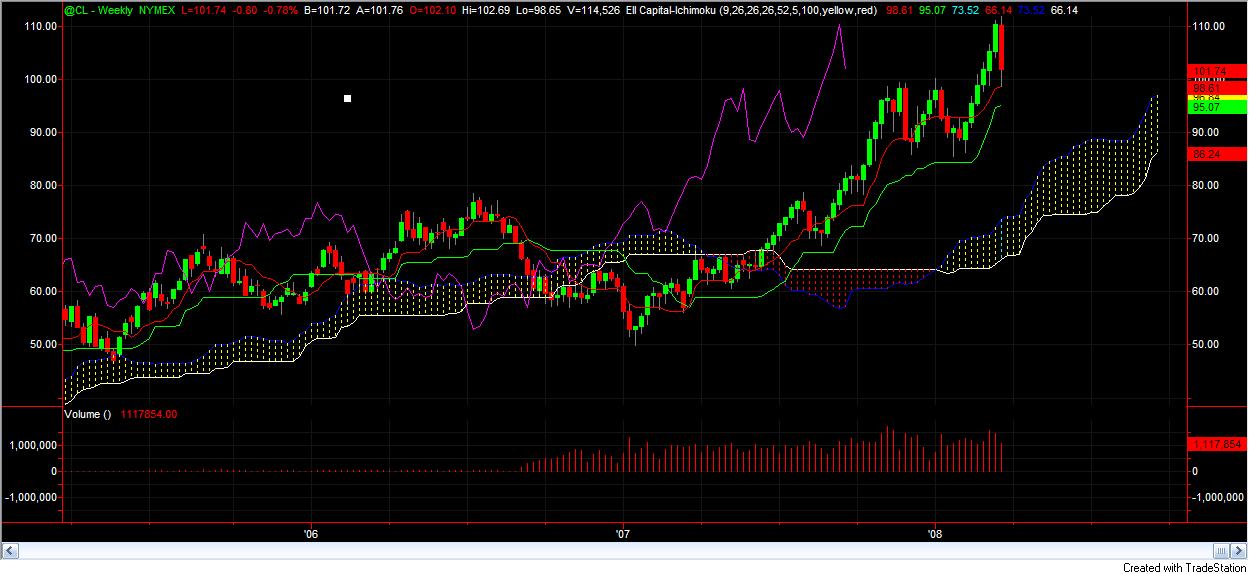
Below is the weekly chart for Crude Oil. It is similar to the Gold, Soy, and Corn
Most of the Commodity futures and stocks are showing the exact same pattern. Most of them are on a pull back mode. There is a high probability that the trend will continue. We will be waiting for the bullish continuation trade for all these commodities.
For EDUCATIONAL USE. Commodity Futures Trading Commission, Forex, Futures, Equity and options trading has large potential rewards, but also large potential risk and may not be suitable for everyone. You must be aware of the risks and be willing to accept them in order to invest in these markets. Do not trade with money you can not afford to lose. This is neither a solicitation nor an offer to Buy/Sell. No representation is being made that any account will or is likely to achieve profits or losses similar to those discussed on this document. The past performance of any trading system or methodology is not necessarily indicative of future results. All information provide d on the Blog is for educational purpose .
")