
Precision Trading, Not Gambling: This is how you beat $Bitcoin! When I was a retail trader, like you, I was a gambler. After blowing out my account three times, I learned! Yes, 3 times! Every time, I did it, I dug a hole. Not a hole of money, a hole of confidence, bad habits, and more!
When the markets trended up, I was making great money. When the markets consolidated, I gave my profits plus more. Does this sound like you? Well, understand at this moment, trading is about probabilities! That is it! Not Luck! No Guessing! No Feeling! Nothing!
Bitcoin is a perfect instrument to talk about where people are emotional involved. They trade with emotions, not probabilities! It is time for this to stop! RIGHT NOW! It is time for more retail traders to become professional traders. Time to trade with precision! We will examine the bitcoin trades for this week and show you how it is done professional, not gambling.
If an engineer can become a professional trader, you can do it too! You have to be just humble and be willing to learn.
1. Recognize a pattern
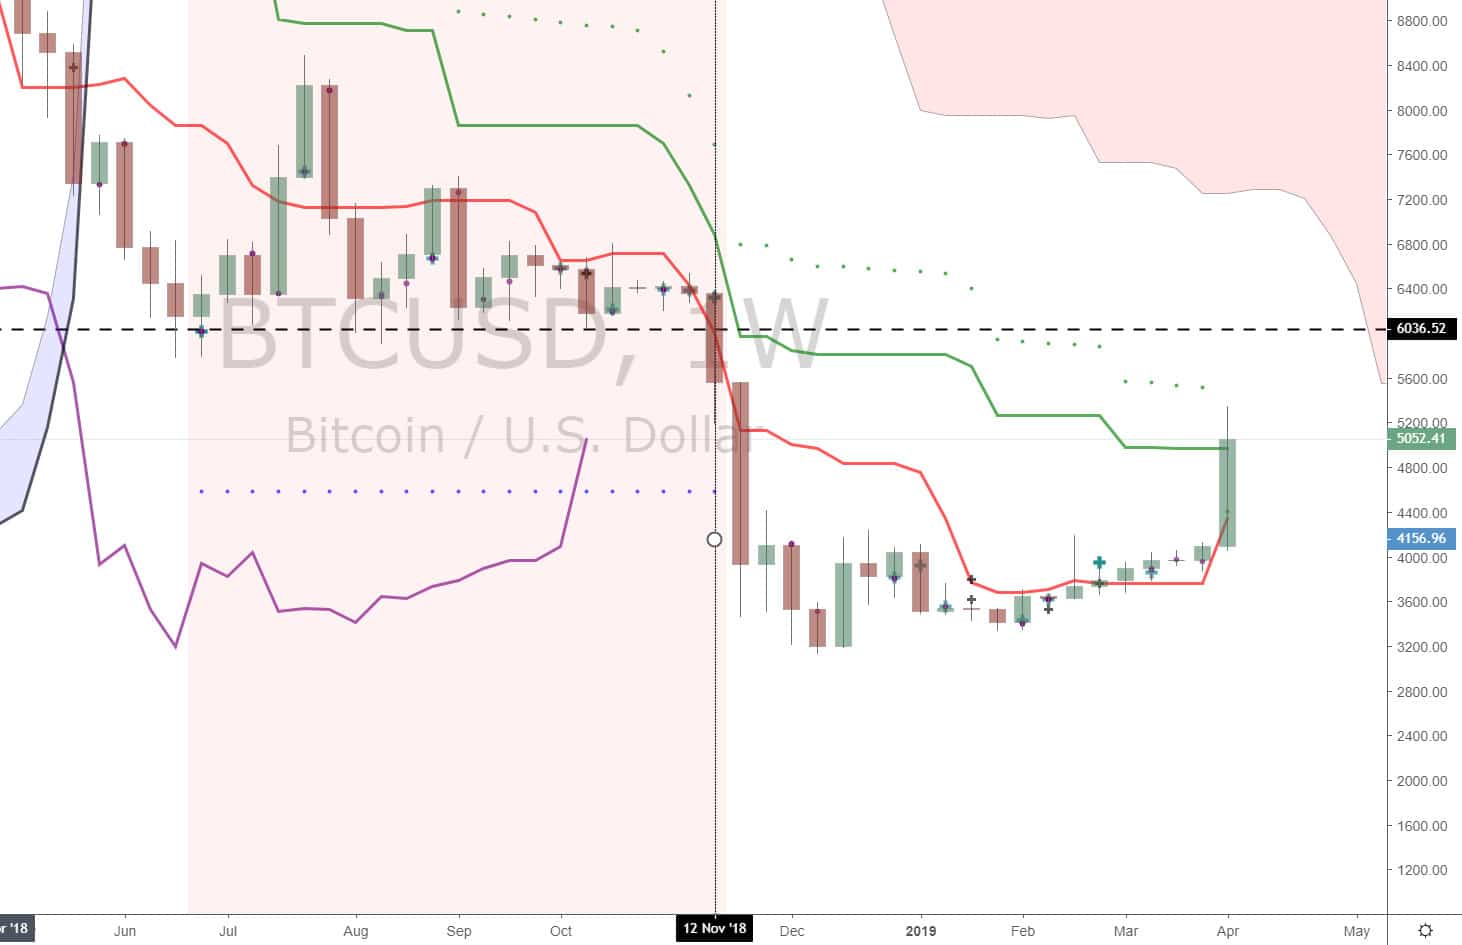
The picture is a weekly chart from TradingView (wwww.imtftrade.com/tradingview). Each bar represents a week worth of price action. Why we looking at a weekly chart? Big money is long term, not short term. We want to trade in direction of the “Big money” where price can move continuously in a certain direction.
On November, 2018, price broke the multiple time frame support (cross in the past establish in June 2018) at 6036.52. This started the bearish trend.
2. Look for a change in Trend. Beginning of an opportunity
From #1, we established a bearish trend started when it broke the support. We now looking for that bearish trend to stop and the beginning of a bullish trend. Why? We want a good reward. This happens when you enter close to the beginning of the trend.
How do we know where the bearish trend ends and a bullish trend or bullish major pull back can occur?
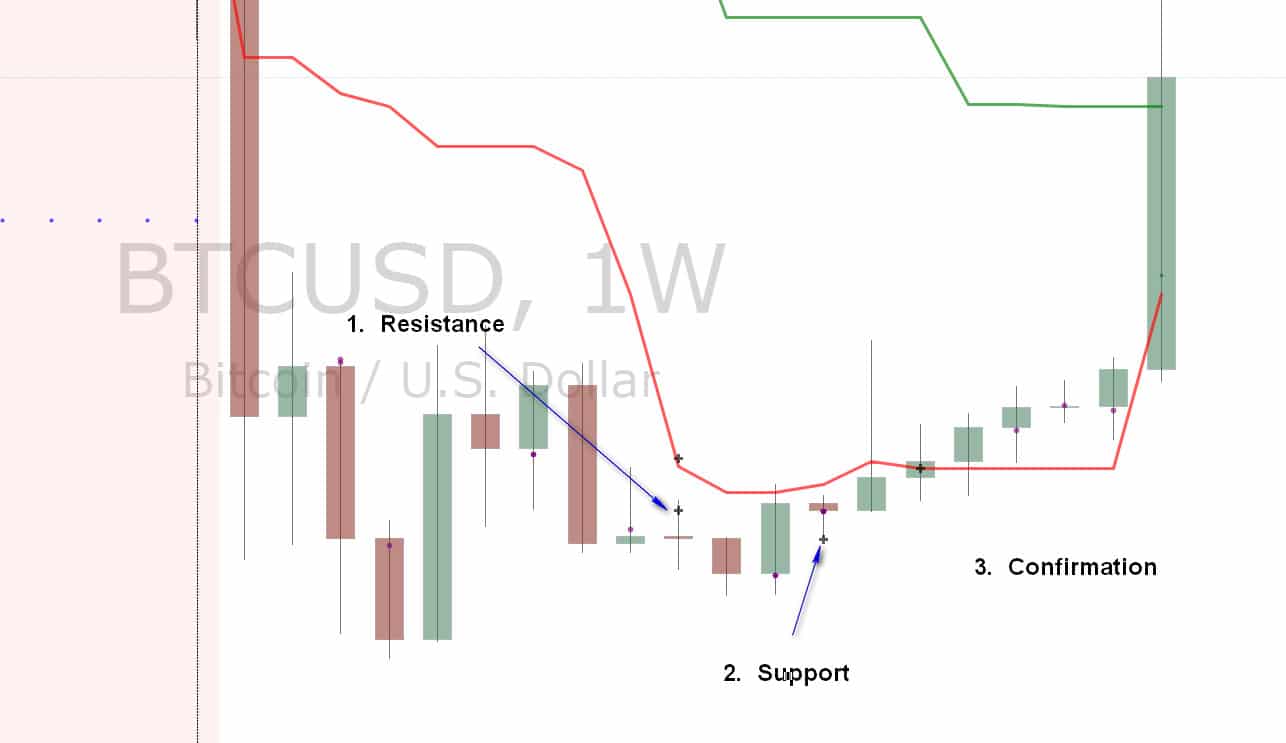
Easy, look at the chart below. Most people do this with a single time frame and the probabilities are low. For us, no! We use the multiple time frame crosses which increase our probabilities. Here are the steps.
a. Notice, we had a multiple time frame cross resistance in pt #1. This is helping the trend stay bearish.
b. Wait for a multiple time frame support now! Notice, I say wait, not guess. We looking a “floor”. You can see this in the chart in pt #2.
c. Look for a confirmation. Why do we do that? At top and bottom, there is a lot of volatility! It can get crazy! This is why we look for a confirmation. Everything is a balance. To get the confirmation and a higher probability, we have to give up some reward. We are good with that because we will be trading on lower time frames where the risk will be low and the reward will still be high. Pt 3. shows a multiple time frame support which is HIGHER than the pt #2. We are looking for supports to go higher across MULTIPLE TIME FRAMES, not a single timeframe! This increases our probabilities drastically.
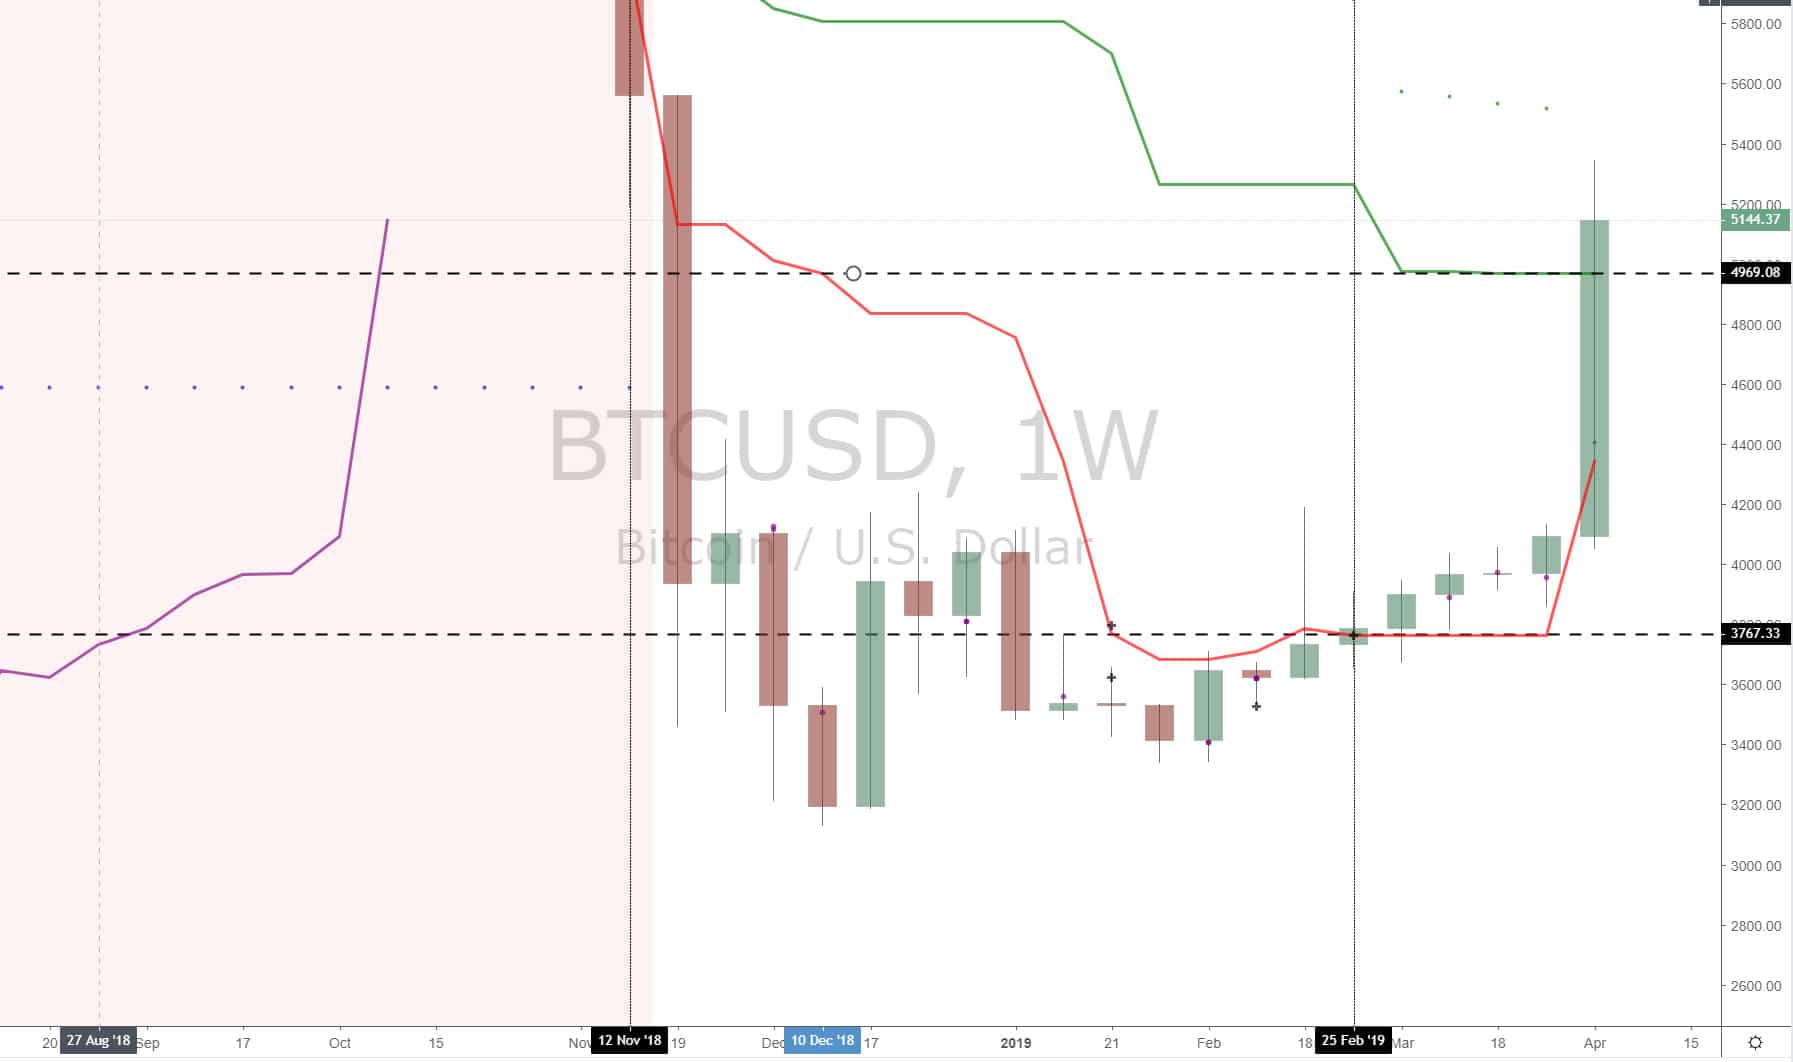
Look at the chart below, February 25, 2019, we got higher multiple time frame support confirmation. It was at the price of 3767. As long as price CLOSE at or ABOVE this price each week, Bitcoin can go up i..e bullish.
On the weekly time frame, it is a bullish pull back to the green line resistance “ceiling” at 4969. This is over 1000 pt movement. If it breaks 4969, then the bullish trend can continue since we will doing a major bullish pull back on the weekly. Right now, we can’t think of all that. That is the big picture. The key as a precision trader is that the support is 3767 which needs to hold to take bullish. Our target will be 4969.
3. Look for Bullish Setup
Feb 25, the higher time frame gave us “permission” to start to look for a bullish trade setup. We want to get the reward off the Weekly time frame but keep the risk low. To keep the risk low, we are going to go to a lower time frame to find the trade setup.
Below is a zoomed out chart setup on the 240 minute chart. We are looking for a green shaded area after February 25, 2019.
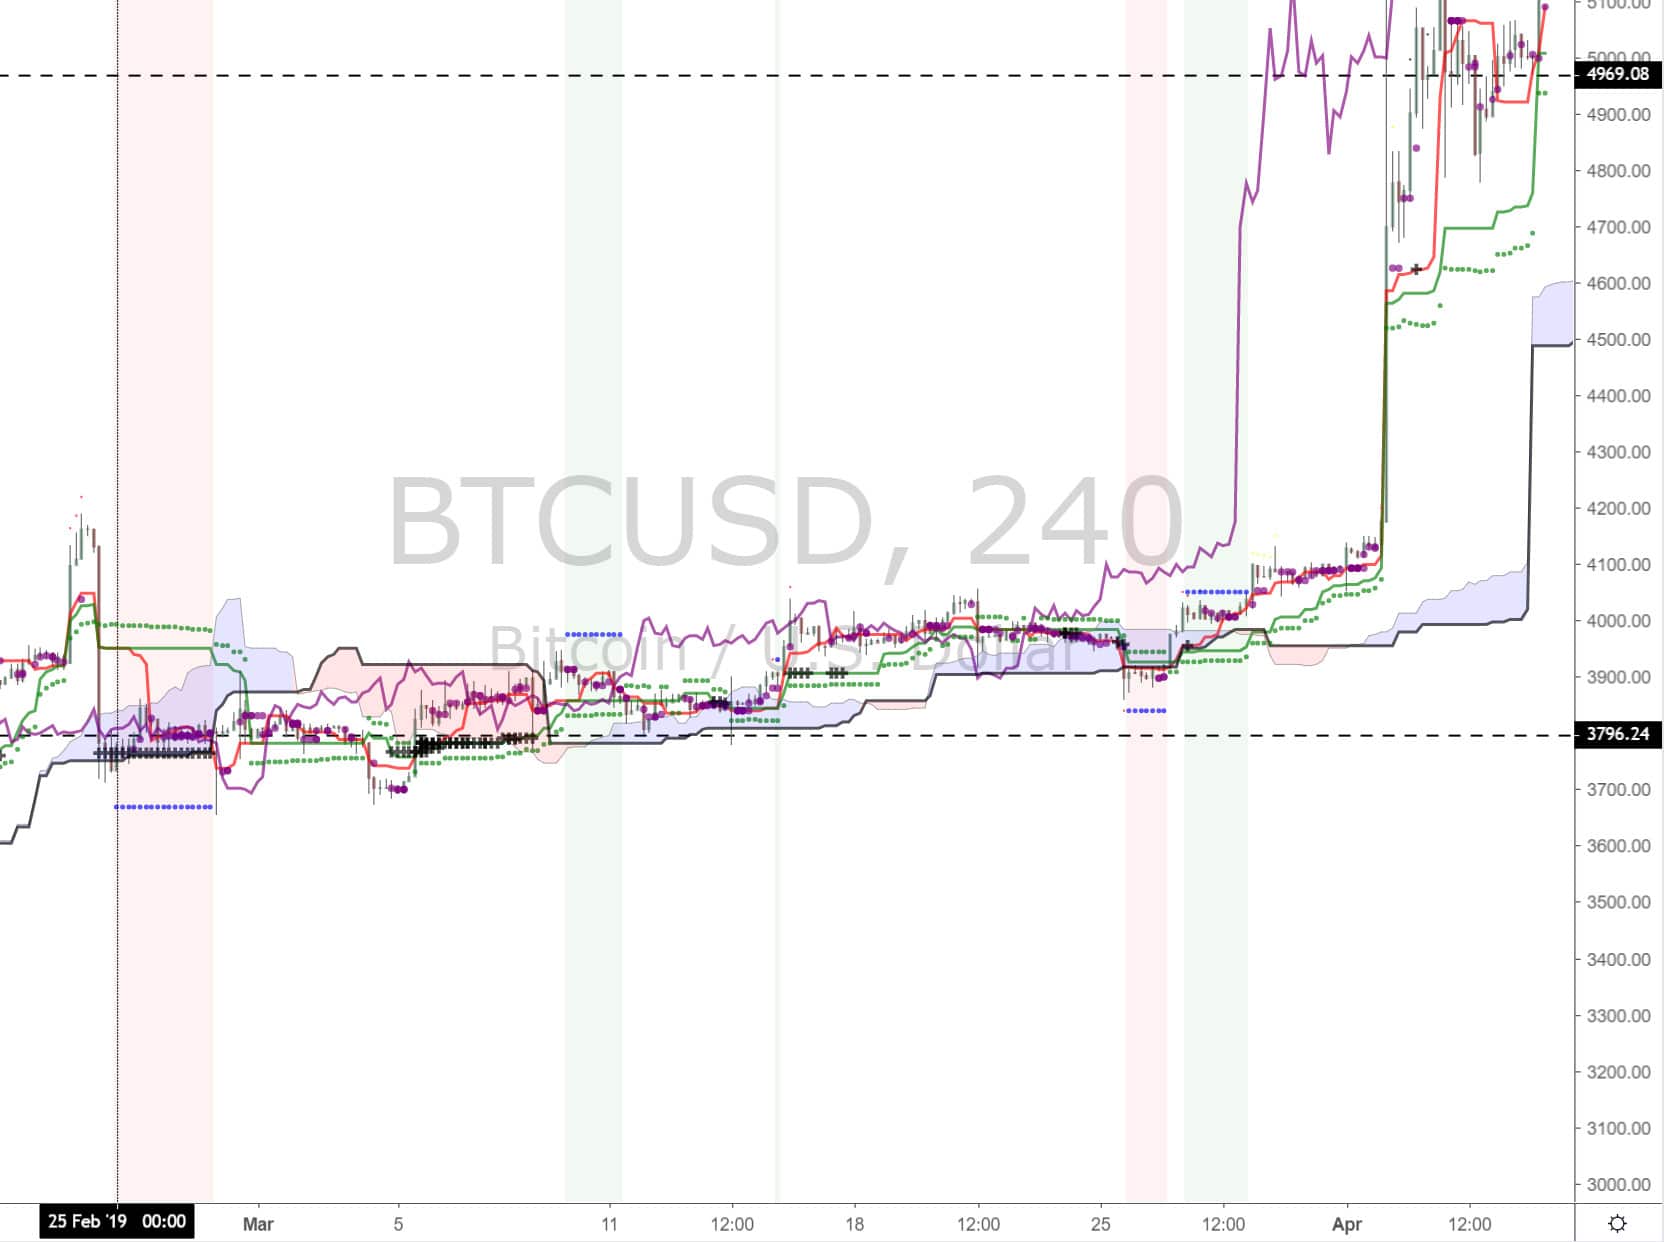
Below is the zoomed in chart of the one bullish setup that occurred and triggered. It shows the trade setup and results.
4. Conclusion
Notice, the entire process was a precise step by step process. This is precision trading where we are trading probabilities. This is not gambling. You can take a high volatility instrument and you can trade it step by step like we just did.
If you would like to learn how to trade like an institutional trader or learn more about our multi-timeframe email alerts, go to www.ichimokutrade.com or email us at info@eiicapital.com
EDUCATIONAL USE.
Risk Disclosure: https://www.imtftrade.com/disclaimer/
")