
Stock Market Holding Multiple Time Frame Support. On October 11, 2018, we posted a Youtube video for the market update. The video is here is if you missed it: Oct 11 US Stock Market Update Link. In this quick update, we outline the E-Mini Sp500 establishing a multiple time frame support 2746.50. We also established a timing element of October 16, 2018 and that being the possible bottom for this market.
Here is the updated E-Mini Sp500 weekly chart provided by $tradingview:
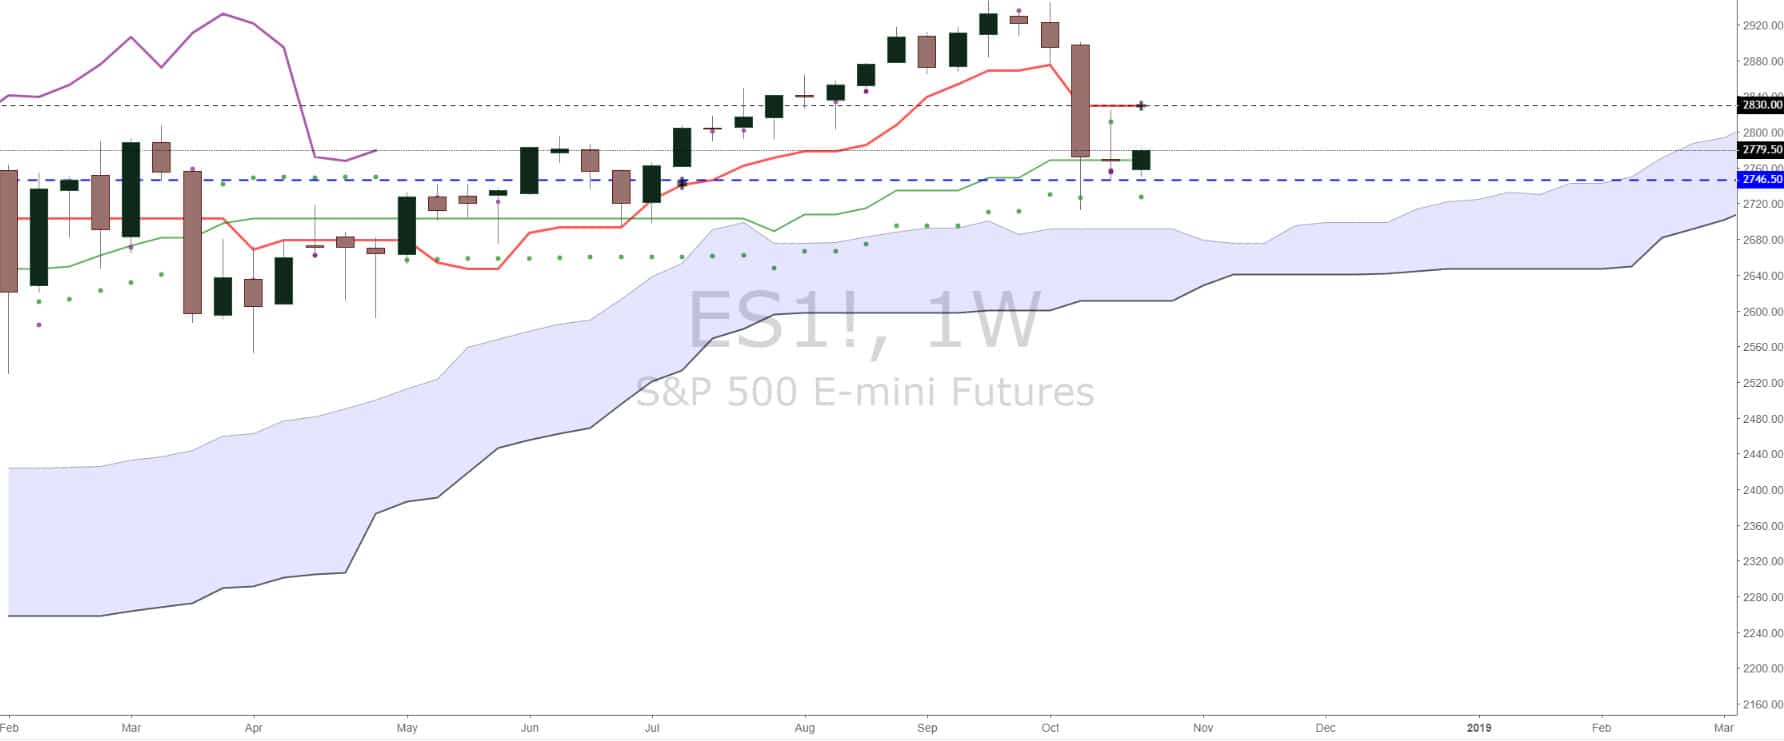
So far, the support is holding week by week. A multiple time frame resistance now has developed 2830. Therefore, we are now in a bullish consolidation pattern between these two levels.
If we break the support, we have a high probability of entering a major pull back which has not happened long term since 2016. If we break the multiple time frame resistance, we will have a high probability to retest the high and register new high’s going to end of 2018.
The other instrument that we look at to gauge the market is the $VIX, the volatility index. It has an inverse relationship with the market and give a great ability to do forecasting with it. If the VIX goes up, the market goes down and vice versa. Below is the daily chart for the $VIX:
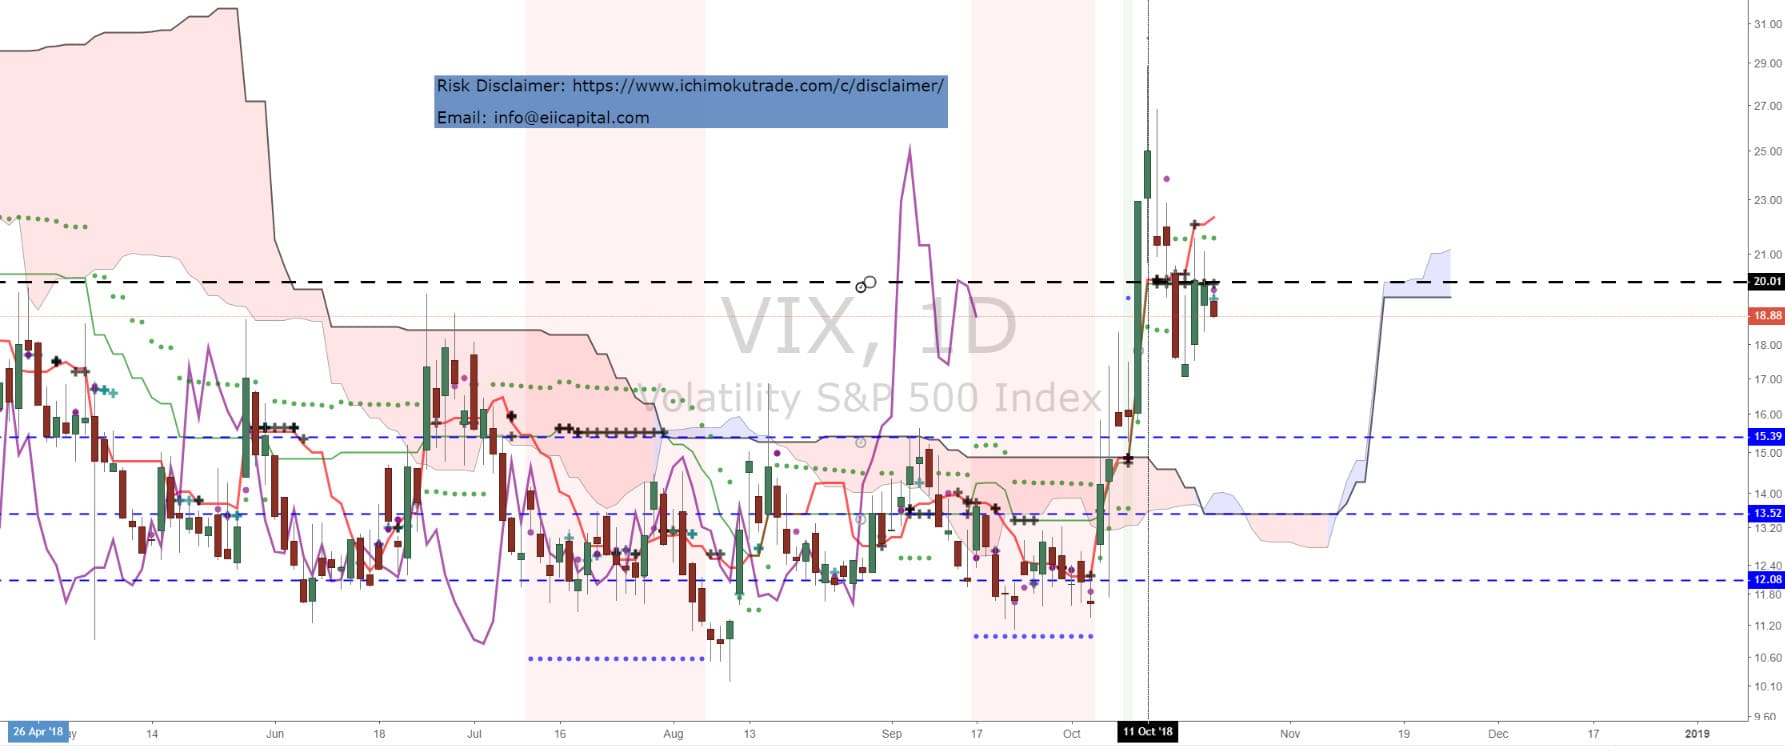
The Blue horizontal line indicate the consolidation pattern we have been using for year for forecasting. October 8, 2018, we broke the resistance which indicated the markets were going through a major pull back short term at least. Short term because this is a daily chart. Oct 10, the breakout level go triggered and how we had a high probability of starting a bullish trend which would be a bearish trend for the US stocks. The key was if it followed through. A multiple time frame support developed around 20.00. This was broken and now a multiple time frame resistance. This resistance is holding increasing the probably to get back 15.39. Therefore, we are ranging between 15.39 and 20 now.
In conclusion, we are short term bullish now since we are in a bullish consolidation pattern going to a support on the $VIX and resistance on the E-mini SP500.
If you would like to learn how to trade like an institutional trader or learn more about our multi-timeframe email alerts, go to www.ichimokutrade.com or email us at info@eiicapital.com
EDUCATIONAL USE.
Risk Disclosure: https://www.imtftrade.com/disclaimer/
")